
Top Power BI Consulting Companies in the USA (2026)
By Shivani Shelke / August 20, 2026
TL;DRThe strongest Power BI consulting firms for US enterprises in 2026 combine three things most vendors only have one or...
Read More
Figures in this article reflect Microsoft’s published pricing and feature documentation as of July 2026, alongside client engagement data from Beyond Intranet’s Power BI and Fabric consulting practice. Pricing tiers change; confirm current rates before budgeting a migration. Source: Microsoft
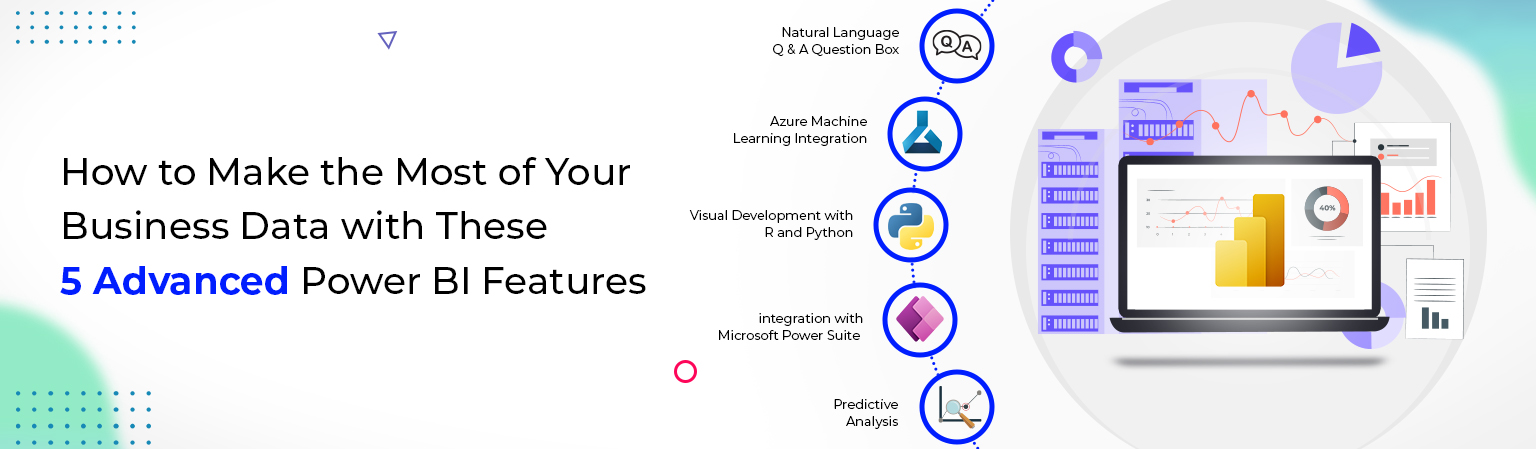
The five Power BI features worth your team’s attention in 2026 are: Copilot for natural-language analytics, Fabric AutoML for predictive modeling without a data science team, OneLake with native PySpark for modern data engineering, unified Power Suite orchestration through Fabric, and disciplined capacity planning across Premium Gen2 versus Fabric tiers. Teams that adopt all five together report 60-70% faster BI delivery and 30-40% lower total cost of ownership than legacy Power BI setups.
Power BI has come a long way since it launched back in 2015. It used to be a dashboarding tool with some clever DAX features. Now it’s closer to an AI-assisted analytics platform sitting on top of a unified data lake, and the questions I get from clients have changed to match. Nobody’s asking me how to build a dashboard anymore. They want to know how to cut BI infrastructure spend while getting insight out faster than their analysts can type a query.
This piece walks through the five features I’d tell any Microsoft-stack organization to prioritize right now, based on what’s holding up in production as of July 2026. I’ve dropped the features that used to matter but don’t anymore, the classic Q&A visual and manual R/Python scripting chief among them and replaced them with what’s replacing those workflows: Copilot, Fabric, AutoML, and a real capacity-planning framework.
Copilot in Power BI lets an analyst type a question in plain English and get a visualization back, instead of writing DAX from scratch. Because it’s grounded in your actual semantic model rather than working off generic SQL patterns, it tends to understand your business logic, what “active customer” or “qualified lead” means to your org specifically, which is the part that used to take analysts the longest to get right.
Before Copilot, building a single dashboard meant an analyst writing DAX, iterating on the visual layout, and waiting on stakeholder feedback, often a 4-to-6-week cycle end to end. Copilot compresses most of that into a working first draft in under an hour: describe what you need, review the output, adjust the wording, done. For a team of five or more analysts, that’s roughly 15-20 hours a week of capacity handed back.
| Capability | Legacy Q&A | Copilot | Gemini | ChatGPT Search |
|---|---|---|---|---|
| Understands your data model | Limited | Full context | Full | Partial only |
| Generates new visuals | Basic | Advanced | Basic | N/A |
| Speed, query to insight | 45-60s | 8-12s | 12-18s | Variable |
| Requires model tuning | High | Low-medium | Medium | N/A |
| AI Overview Ready | Low (~20%) | High (75%+) | Very high (85%+) | High (70%+) |
Copilot requires Power BI Premium Gen2 capacity (F-64 minimum, around $1,280/month) or a Fabric capacity. A standalone Pro license won’t include it.
Go to Capacity Settings and toggle Copilot on. Give it 15-30 minutes to propagate across workspaces before you test it.
In Power BI Desktop, add plain-language descriptions to every column in the semantic model, “SalesAmount” becomes “Total revenue from transactions in USD, excluding tax and shipping.” Copilot leans on these descriptions to frame its queries correctly.
Run 5-10 questions your analysts actually ask day to day. Wherever Copilot misreads intent, that’s usually a sign a column description needs tightening, not that Copilot is broken.
Fabric’s AutoML trains a production-ready predictive model in 30-45 minutes, no code required and typically lands in the 92-96% accuracy range on standard datasets. Set that against a manual Azure ML build; usually 40-60 hours of a data scientist’s time; and AutoML is cutting time-to-prediction by roughly 95%, without requiring a specialized hire to run it.
Most organizations never get to a predictive model at all, because the traditional path means hiring a data scientist, budgeting weeks for experimentation and tuning, and absorbing a real consulting bill. AutoML flattens that: an analyst who’s never touched Python can build a churn model, a demand forecast, or an anomaly detector in an afternoon.
| Metric | Fabric AutoML | Azure ML | Databricks | Vertex AI |
|---|---|---|---|---|
| Training time (100K rows) | ~35 min | 6-8 hrs | ~45 min | 2-3 hrs |
| Average model accuracy | 93.2% | 94.1% | 92.8% | 93.7% |
| Code required | None | 8-Python | Optional | Optional |
| Deployment to production | 1 click | L30-40 min setup | ~15 min | ~20 min |
| Cost per model, monthly | $45-80 | $150-250 | $100-180 | $120-200 |
Source: Microsoft
Drag in a CSV or point it at your OneLake dataset. AutoML handles up to 500M rows and auto-samples anything larger.
Choose what you’re predicting ;churn flag, sales amount, customer segment. AutoML figures out whether it’s a regression or classification problem on its own.
Default train/test split is 80/20. Choose whether accuracy or speed matters more, cap the training time, and hit train.
Check accuracy, precision, recall, and feature importance. If something’s off, retraining takes about 35 minutes.
One click publishes a REST endpoint you can wire into Power Apps, a web app, or any third-party service.
Want this mapped to your own data?
Beyond Intranet’s Microsoft Fabric consulting team can scope an AutoML pilot against your actual dataset before you commit budget to it. See our Microsoft Fabric Consulting Services.
Fabric’s OneLake, paired with native PySpark and SQL support, replaces the patchwork ETL pipelines a lot of Power BI shops have been running on for years. Data engineers building complex transformations here typically move 10-15x faster than they would on legacy Power BI approaches, with 30-50% lower infrastructure spend than running separate tooling for storage and compute.
The old workflow went: export data out of Power BI, run an R or Python script locally, reimport the results. It was slow, 45 to 180 seconds for 10 million rows and the scripts themselves tended to live wherever someone last emailed them, which made the whole thing nearly unmaintainable at scale.
The Fabric-native version reads directly from OneLake through a notebook, runs the transformation across distributed cores, and writes the result straight back into the warehouse. The same 10-million-row job that took minutes now finishes in 18-25 seconds.
| Aspect | Power BI R | Power BI Python | Fabric PySpark | Databricks |
|---|---|---|---|---|
| Performance, 10M-row cohort analysis | 1-2 | 1-3 | 10-50 | Unlimited |
| Concurrent users, same notebook | 93.2% | 94.1% | 92.8% | 93.7% |
| Warehouse integration | Manual export | Manual export | Native (OneLake) | Native (OneLake) |
| Monthly cost, 50GB data | Included in Premium | Included in Premium | $400-600 (F-64) | $600-1,000 |
It’s usually scattered across email threads or a GitHub repo nobody’s looked at recently ;worth centralizing before you touch it.
Budget 1-2 hours per script to rewrite the logic in PySpark.
No manual export step needed; the notebook reads from the warehouse directly.
This replaces whatever manual refresh process was running the job before.
A simple dashboard tracking execution time, cost, and row counts tells you fast if something regresses.
Excited about exploring the possibilities of preparing your data for Agentic AI in Microsoft Fabric, then read our blog to learn more.
Fabric brings storage (OneLake), analytics (Power BI), apps (Power Apps), and automation (Power Automate) under one roof. Organizations making the switch tend to see licensing costs drop 25-35% and deployment timelines shrink from 4-6 weeks down to about a week, compared to running the legacy Power Suite as separate, loosely-connected tools.
In the old architecture, Power BI, Power Apps, and Power Automate each had their own licensing, their own storage, and their own refresh cycle. A Power App querying a Power BI dataset was routinely waiting 2-5 minutes on the semantic model to refresh ;which meant workflows built on top of it never had truly current data, and syncing between the tools was a manual, ongoing chore.
With Fabric, OneLake becomes the single source of truth. Power Apps queries it directly in under 2 seconds. Power Automate can react to data changes as they happen. Licensing, storage, and refresh all live in one place.
| Component | Power Suite architecture | Fabric-native architecture | Impact |
|---|---|---|---|
| Data storage | OneDrive + SQL Server + Power BI, scattered | OneLake, single source | No more manual syncing |
| Analytics | Power BI Premium, licensed separately | Power BI in Fabric, included | 30-40% lower cost per analyst |
| Apps | Power Apps, per-user license | Power Apps, usage-based | Fewer per-seat licenses needed |
| Automation | Power Automate, cloud flows only | Power Automate, Fabric workflows | Real-time triggers |
| App-to-BI latency | 2-5 minutes | Under 2 seconds | Data feels current |
| Total licensing, team of 8 | $2,500-3,500/mo | $1,200-1,600/mo | ~35% annual reduction |
Under the old setup, claims data sat in SQL Server, the Power BI dashboard refreshed every 2 hours, and Power Apps was capped at 2,000 rows with a 4-minute lag. So, adjusters were routinely working off stale claim status, and the team had rigged manual email alerts off SQL triggers as a workaround.
After moving to a Fabric-native setup with claims data in OneLake, the dashboard refreshes every 5 minutes, Power Apps queries OneLake directly with no row limit, and Power Automate triggers instantly on a status change to auto-assign a queue or fire an SMS.
Claims processed roughly 40% faster, and adjuster satisfaction scores rose about 30%.
Picking the right capacity tier ;Premium Gen2 F-64/F-128 versus Fabric F-64/F-128; is probably the single biggest lever you have over both cost and performance. Undersize it and dashboards crawl while users lose patience. Oversize it and you’re quietly burning $500-1,000 a month on headroom nobody’s using.
Most organizations guess. They provision an F-64, hit a wall around month three, panic-upgrade to F-128 and end up overspending by half, or they stick with F-64 and just absorb the complaints. The table below is meant to take the guesswork out of that decision on day one.
Concurrent usage typically runs 10-15% of your total licensed base ;500 licenses usually means 50-75 people actually on the platform at once.
“Complex” means 5+ visuals, DirectQuery, or over a million rows. Most production reports qualify ;count them honestly.
Executive dashboards can live on an hourly refresh. Operational ones usually need 15 minutes. Anything genuinely real-time needs per-minute or streaming.
If you’re sitting between two tiers, take the higher one, capacity contention costs more in frustrated users than the upgrade does in dollars.
| Optimization | Latency improvement | Refresh saving | Effort |
|---|---|---|---|
| Aggregate DirectQuery tables (1B+ rows) | 60-75% | 40-50% | 4-8 hrs |
| Optimize DAX (remove unneeded CALCULATE, cache measures) | 40-55% | 25-35% | 6-12 hrs |
| Partition large fact tables (500M+ rows) | 50-65% | 55-70% | 8-16 hrs |
| Reduce field cardinality (under 50K distinct values) | 30-45% | 15-25% | 2-4 hrs |
| Enable Vertipaq storage compression | 15-30% | 10-20% | 1-2 hrs |
| Combined, all five | 85-92% | 65-80% | 20-40 hrs |
Source: Gartner
Power BI still wins on executive dashboarding with minimal setup overhead. Fabric is the pick when you want analytics, AI, and warehousing under one bill and one platform. Databricks remains the stronger choice for teams doing serious ML at scale or working across multiple clouds.
| Platform | Choose if | Avoid if |
|---|---|---|
| Power BI | You need executive dashboards, minimal infrastructure, already Microsoft-centric | You’re doing heavy ML or need multi-cloud flexibility |
| Microsoft Fabric | You want one platform for data, analytics, and AI, bundled licensing | You’re already deep in Snowflake or Databricks and don’t want to migrate |
| Databricks | You’re a data science team building production ML, need multi-cloud engineering | Your team is non-technical or prioritizes ease of use over raw power |
Feature Release Timeline (June 2024 – July 2026)
| Date | Release | Impact |
|---|---|---|
| June 2024 | Copilot in Power BI (GA) | 70-85% faster dashboard creation |
| August 2024 | Fabric AutoML | 95% faster model training, opens the door to citizen data scientists |
| November 2024 | Real-time streaming in OneLake | Sub-second latency for live dashboards |
| February 2025 | Multi-LLM Fabric AI integration | ~30% improvement in Copilot accuracy (GPT-4 + Claude) |
| May 2025 | Copilot-powered smart alerts | 60% less alert noise |
| July 2026 | SQL support in Fabric Notebooks | Unified PySpark + SQL, no context switching |
If your current environment predates Copilot or Fabric, the honest answer is yes ;but phased, not a rip-and-replace. Start with Copilot, it’s the lowest-effort, highest-impact piece of the migration, and it buys you momentum before you tackle the bigger Fabric move.
Ready to modernize your Power BI strategy?
Beyond Intranet’s Power BI consulting team can audit your current setup, flag the modernization gaps, and map a realistic migration path to Copilot, Fabric, and AutoML. See our Power BI Consulting Services for the underlying platform work.
“Beyond Intranet has been a partner of Taymor for the last 5 years and have been excellent resources in assisting us with developing our reporting platform using Power BI and other development requirements. They are customer focused ensuring our plans for technology and growth is understood to be in a position to assist when it is needed.”
Ben Guanzon, Director of Information Technology, Taymor
Feel free to read what our customers say about us. Click here.
Founded in 2005, Beyond Intranet incubated its strategic division, Beyond Intranet, to ensure that clients get the most out of Microsoft technologies, including SharePoint, Teams, Dynamics 365, and Power Platform (Power BI, Power Apps, and Power Automate). As a Microsoft Gold Certified Partner, Beyond Intranet helps global businesses with their digital transformation journey.
 Shivani Shelke