In today’s world, business intelligence (BI) has made a major impact by establishing a market for itself.
BI has helped manage our data to make it easily accessible and analyzed so that decision-makers can come to conclusions quickly and easily.
To give you some context, 75% of the global workforce uses BI regularly.
But the problem is that many are still unaware of some of the advanced features BI offers to help their business scale exponentially. Today, we will share those Advance Features of BI with you that not only helps save time but will let you use your data in hand with better clarity.
Top 5 Advanced Power BI Features
- Natural Language Q & A Question Box
- Azure Machine Learning Integration
- Custom Visual Development with R and Python Script
- Easy integration with Microsoft Power Suite {Power App, Power Automate, and Power Query}
- Predictive Analysis
1. Natural Language Q & A Question Box
- Sometimes the quickest way to get answers from our data is to ask using natural language. For illustration,” what were the total sales last time.”
- Making Q&A explore data using intuitive, natural language capabilities and admit answers in the form of maps and graphs. Q&A is different from a hunting machine- Q&A only provides results about the data in Power BI datasets.
- To produce a featured question, select the further options ellipsis in the top-right corner of Power BI, point to Settings, and select Settings. Select Datasets> Retail Analysis sample> Featured Q&A questions. Select Add a question. We can type our questions in the text box.
Which visualization does Q&A use?
- Q&A picks the stylish map or graph grounded on the displayed data. Occasionally data in the underpinning dataset is defined as a specific type or order, and this helps Q&A know how to show it. For example, if data is described as a data type, it’s more likely to be displayed as a line map. Data distributed as a megacity is more likely to be displayed as a chart.
- We can also tell Q&A which visual to use by adding it to your question.
- But we should understand that it may not always be viable for Q&A to display the data using the visual type we requested. Q&A will prompt us with a list of workable visual types.
The Q&A visual in Power BI reports
- In Power BI reports, there’s a specific type of interactive visual called the Q&A visual. When a report developer adds this visual to a report, report end users can ask natural language questions and produce a new report visual that represents the answer to that question. The Q&A visual behaves like other illustrations in a report; it can be cross-filtered/cross-highlighted and supports bookmarks and commentary.
- We can identify a Q&A visual by its question box across the top. This is where we’ll enter or class questions using natural language. The Q&A visual can be used repeatedly to ask questions about our data. When we leave the report, the Q&A visual resets to its dereliction.
2. Azure Machine Learning Integration
- Since this point also involves integration with machine learning in Power BI, it would help the users with the complete visualization of the outcomes of the Machine Learning Algorithm. This can be done simply by dragging, dropping, and connecting all the data modules.
- The first step to integrating an Azure ML model with Power BI is to train the said model using any options available in “Azure ML Resources” and post it consequently. The model is also read from Power BI and integrated with a dataset. Latterly, the model output is displayed in the Power BI dashboard.
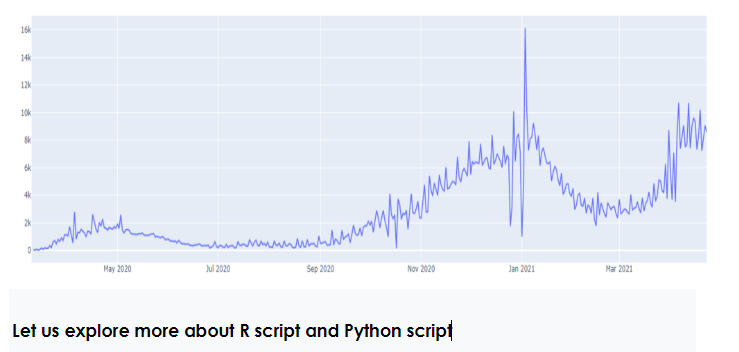
3. Custom Visual Development with R and Python Script
While Power BI supports numerous standard data visualizations out of the box, it’s also possible to make our own with custom data visualizations. By adding open-source data- viz libraries from R and Python, judges can produce largely customizable visualizations to add to their coming Power BI report.
What is R Script?
An R script is a text file containing (nearly) the same commands that you would enter on the command line of R.(nearly) refers to the fact that if you’re using sink() to shoot the output to a file, you’ll have to enclose some commands in print() to get the same output as on the command line.
Can Power BI be used with R?
The Power BI services supports viewing and interacting with illustrations created with R scripts. Illustrations created with R scripts, generally called R illustrations, can present advanced data shaping and analytics similar to forecasting, using R’s rich analytics and visualization power.
How can we write an R script in Power BI?
- In Power BI Desktop, select Get Data, choose Other> R script, and also select Connect.
- Just copy our script into the script window and select OK, If R is installed on our original machine. The rearmost installed interpretation is displayed as your R machine.
- Select OK to run the R Script.
What is Python script?
A Python script is a pack of commands in a file designed to be executed like a program. The file can contain functions and import colorful modules, but the script must be run within a Python interactive shell or through the command line to achieve a specific task.
Can Power BI be used with Python?
Using Python in Power BI, we can extend the normal capabilities of the tool and enhance the way Power BI works. We can perform external data analysis using frameworks like Pandas, run external Python scripts from Power BI, produce and manipulate datasets, and produce visualizations using Python libraries.
How do you write a Python script in Power BI?
- In Power BI Desktop, select File > Options and settings > Options > Python scripting. The Python script options page appears.
- If necessary, specify your local Python installation path in Detected Python home directories.
- Select OK.
4. Easy integration with Microsoft Power Suite {Power App, Power Automate, and Power Query}
Power BI is presently available as part of the Office 365 Enterprise E5 version.
- Integration of Power BI with Power Automate
Use Power Automate to merge Power BI with your favorite apps and services. With Power Automate, we create automated workflows to get notifications, synchronize files, collect data, and more.
- How can we integrate Power BI and Power Automate?
In Power BI Desktop, On the Insert tab, select Power Automate (preview) in the Power Platform section. Once you choose the visual, it automatically gets added to your current report runner with getting started instructions.
- Power Automate can Pull Data from Power BI
With Microsoft Power Automate, you can automate exporting and distributing Power BI reports to various formats and scripts. In this composition, you create your inflow from scrape. You use the Import to train for Power BI Reports action to automatically distribute a Power BI report via email.
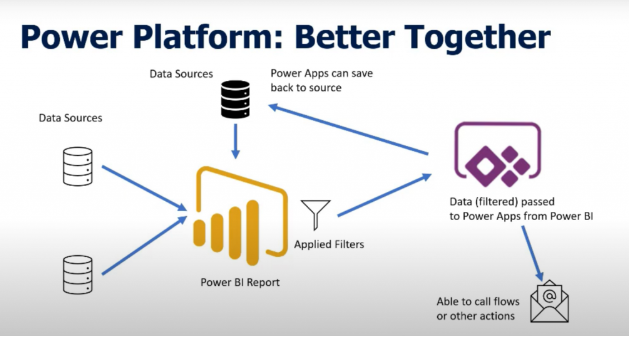
- Integration of Power BI with Power App
Power BI and PowerApps are crucial parts of the Microsoft Power Platform. Once you use these tools, you can enjoy lots of business openings.
With PowerApps and Power BI integration, we have a bigger picture and more significant perceptivity into our business while making the utmost of our information.
Power apps in Microsoft refer to the enhanced app development terrain that allows us to make robust and custom operations. It comes with an excellent collection of functions, data platforms, connectors, and services necessary for speeding up the entire app development process.
How to Integrate Power BI with PowerApps?
Power BI and PowerApps work in tandem, regardless of who initiates them. We can develop business processes that give crucial visualization and analysis once these two platforms are connected. We can also act immediately from anywhere and anytime, thanks to the apps we built using Power BI and PowerApps connectivity.
Step 1: Create a Data Set
Step 2: Create an Invoice Data Table
Step 3: Create a Power BI Report
Step 4: Publish the Power BI Report
Step 5: Calculate the Due Over Delays
Step 6: Switch to Report Edit Mode
Step 7: Choose the Fields
Step 8: Design the Application
Step 9: Modify and Design the Default Gallery Layout
Step 10: Create the Item Controls
Step 11: Add a Screen for Email
Step 12: Add an Email Icon
Step 13: Name the Application
Power BI and PowerApps integration bring uniqueness to a business’s market. If we have the opportunity to create multi-faceted business applications, we can efficiently meet all our business requirements. We also have the chance to shape the future of our business.
5. Predictive Analysis
Predictive analysis is a proficiency to see what will happen in the future. The predictive analytics model uses applied mathematics techniques with evolving technologies, like computing and Machine Learning to create correct predictions.
The predictive analysis answer uses current and historical facts, events, or patterns in historical and transactional knowledge.
Power BI element Auto ML automates machine learning model creation so that users will build high-quality predictive models.
Data visualization with Artificial Intelligence reflects the main elements of our data forcing predictions through our machine learning models.
Predictive Analytics in Power BI
Predictive analytics could be challenging, requiring a spread of study techniques and analytical capabilities. However, we can summarize the predictive analytics world in four straightforward steps.
- Determine the problems and solutions that require predictive analytics.
- Evaluate knowledge assortment and experimentation.
- Build and train an exact predictive analytic model.
- Business Method Automation to introduce unjust insights in business applications.
Conclusion
As per Gartner’s report, by 2020, businesses using BI have an increase in profits compared to those not using BI. Over the years, Power BI has cemented itself as a business intelligence and reportage tool that enables users to form intuitive reports. These advanced features make BI even more robust and flexible. You get more options for reporting and sharing, along with various elements to tailor solutions to precise needs. So, explore the advantages of these advanced Power BI features and make the most of your business data seamlessly.