

Client business description
Our client is a one of the leading groups for specialty performance coating products. The products of the company help in protecting and beautifying anything that is made of concrete, metal, stone, wood, glass, or plastic.
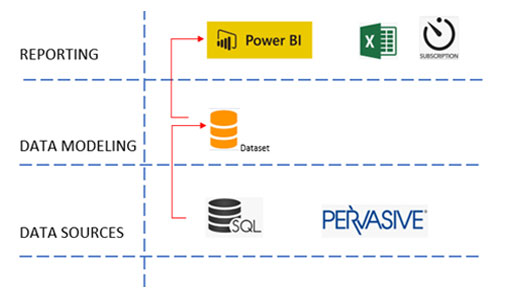
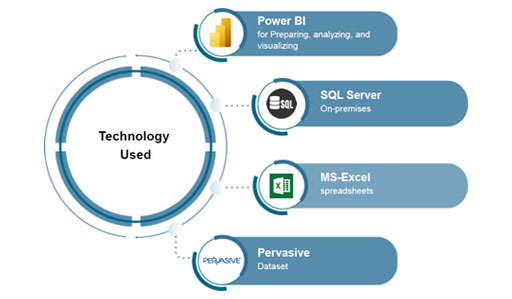
Our client wanted data management and visualization for their existing dataset using Power BI reports. They had an existing reporting system but since his was not fetching accurate and required results they needed to update this system. However, they were not sure about the database tables, which is why they added Beyond Key as their data modeling and visualization partner who could help them load, transform, model, analyze, and visualize data.
Solutions
Beyond Key understood that the data source discovery was vital to the process. We performed a thorough analysis of the source data to find the correct data table and architecture in the legacy reporting system.
Additionally, using the redesigned data architecture and reporting logic, we developed custom Power BI reports from scratch and validated them with the previous reports to make sure we added value to the client’s business with accurate reporting.

Power BI Dashboards And Reports
We created the following sales-related dashboards and reports for the client.
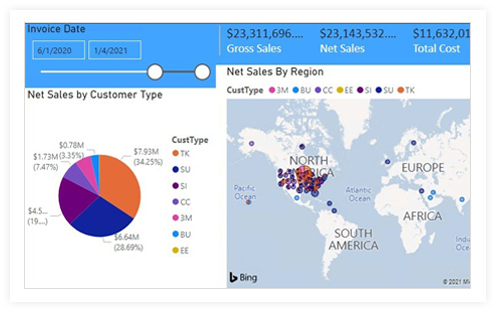
Sales By Region And Item
This was one of the major dashboards developed for the client, which offered them a quick view of their entire sales by geography and product range. The dashboard captured gross sales, net sales, profit, and margins with more details of the customer and geography-wise net sales.
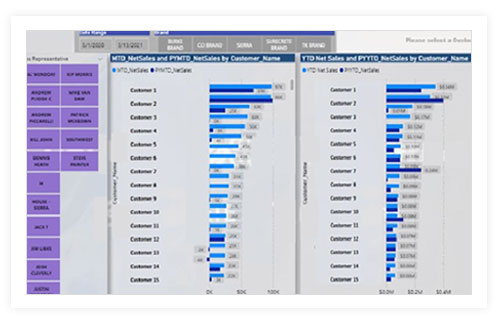
Sales Team Performance
This dashboard showed month-to-date and year-to-date net sales by customer name. Filters could be applied to break the sales down by sales representatives. This report gave a glance at the performance of individual sales reps.
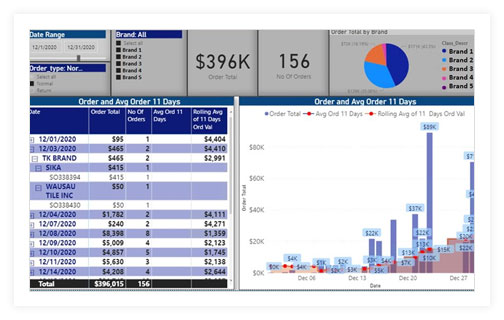
Order And Order Average Of 11 Days
This was a specific dashboard for client that reported KPIs by order value with an average of 11 days. Total order value by the individual brand was shown in a pie chart. The number of orders could be filtered with the date range and type of orders like normal and return orders.
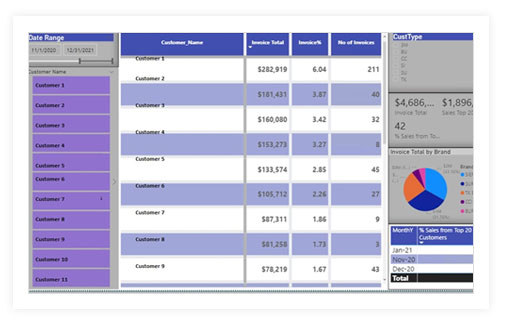
Top 20 Customers
This dashboard gave a bird’s eye view of their top 20 clients based on income and the business given by each of them. The dashboard tracks the total amount of invoices and the number of invoices. The company can also review this information by the pie chart in the corner.
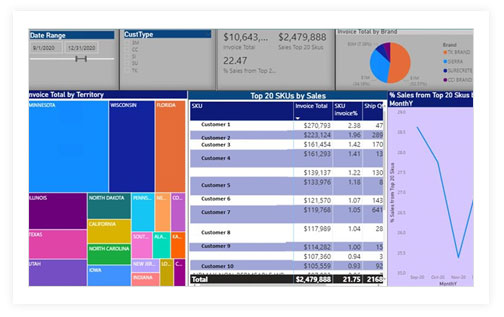
Top 20 SKUs By Sales
This intuitive dashboard gives the top 20 products by sales and breaks down the invoice totals by territory and brand. Other than this month-wise sales percentage from the top 20 SKUs is also depicted with a line chart.
Result
With the implementation of powerful and robust BI reports and dashboards, the client team could view and manage their business and scale up the sales productivity.
- Data sources: Identify the right data table sources and the capability to update this data as necessary.
- Improved productivity: Easy navigation between pages with information on how to use a particular visual for understanding
- Scalable reporting process: Get accurate reports with the right data mapping and measures.
- Time and cost efficiencies
- 360-degree view of the performance: Get a visually strong system with a consolidated performance of the business at first glance.
- Data security: Reports in Power BI is backed up Advanced level of data handling security.


True SharePoint Experts!
We have worked with Beyond key on the development of our company intranet which is hosted in [...]
- Leon Allard

Excellent Tool and Customer Support
This tool is excellent, it is simple to use and configure and meets our business need.[...]
- Andy French

Amazing APP & support. Don't change.
We are using this as a people finder for our college. We did look at a few options[...]
- Darren Evans

Outstanding Support
App worked out of the box, I had a few questions on configuration so I email[...]
- Matt Williams

How to Enhance New Employee Onboarding Experiences?
Getting your new employee up to speed can be a difficult task for even the most established companies. It’s a careful balancing act...

The Ideal Employee Onboarding Checklist for Increased Efficiency...
Emails get lost in the inbox, physical documents get misplaced and that’s when management starts to notice the communication…

9 Best practices for flawless Employee Offboarding
No company likes employees leaving the organization when they become assets to the whole system. Inevitably…

Use the News web part on a SharePoint page
Web parts are the main characteristic of your page in the site. One such dynamic web part is the news web part…

How to get Custom Theme for your Modern SharePoint site
A couple of months ago, Microsoft introduced new branding and theming capabilities for the Modern SharePoint sites in Office 365…