Get a Centralized view of all your Strategies with our Marketing Dashboards.
Ask for A Demo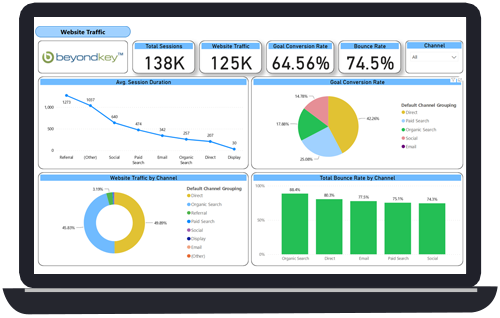
What is a Marketing Dashboard?
In today's competitive environment, marketing departments and agencies must manage massive amounts of data using static reports and spreadsheets, which can result in complexity and the loss of important data. The solution to resolve this complexity is our Marketing Dashboards for all the levels of departments from junior, c- level to managers.
A Marketing Dashboard is a management tool that helps experts track, analyze, and communicate crucial KPIs for marketing through data visualization to recognize and compare various metrics and, eventually, improve the overall effectiveness of marketing.


What are Marketing KPIs and their importance?
Within marketing analytics, there are many effective marketing KPIs to monitor. Marketing KPIs are measurable goals that a marketing company team wants to accomplish over a predetermined time frame. For instance, KPIs can affect the marketing division's performance (increase form completions on your landing page by 50%) or the entire business's performance (like increasing revenue).
Here is a list of some of the key marketing KPIs and analytics which can be beneficial for marketing team members to track:
Why are Our Marketing Dashboards the best fit for your organization?
Marketing dashboards do not always dumb down the data; rather, they will make it easier for you to understand. Its interactive features enable you to study vastly more data on your own and formulate better questions than a traditional spreadsheet could.
Tactics dashboards are beneficial since they display soft metrics (engagement, awareness, interactions, etc.). However, in addition to online marketing data, you will want a dashboard that can also show hard metrics (like the internal rate of return and the net present value of your current campaigns) (such as bounce rate, total visits, click-through rates, etc.). You should use a marketing dashboard for this reason. Additional reasons for why your organization should include Beyond Key’s marketing dashboards are stated below:
Would you like to track your Marketing metrics?
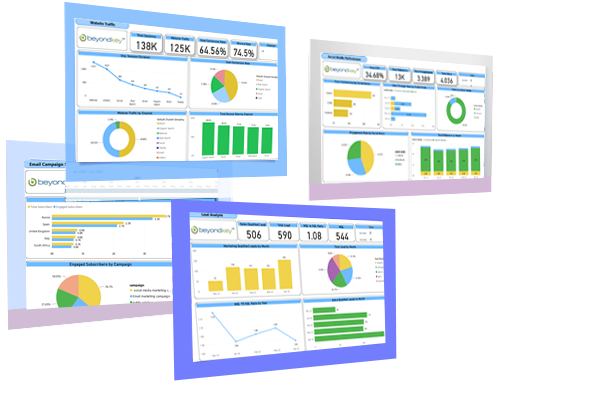
MARKETING DASHBOARD EXAMPLES
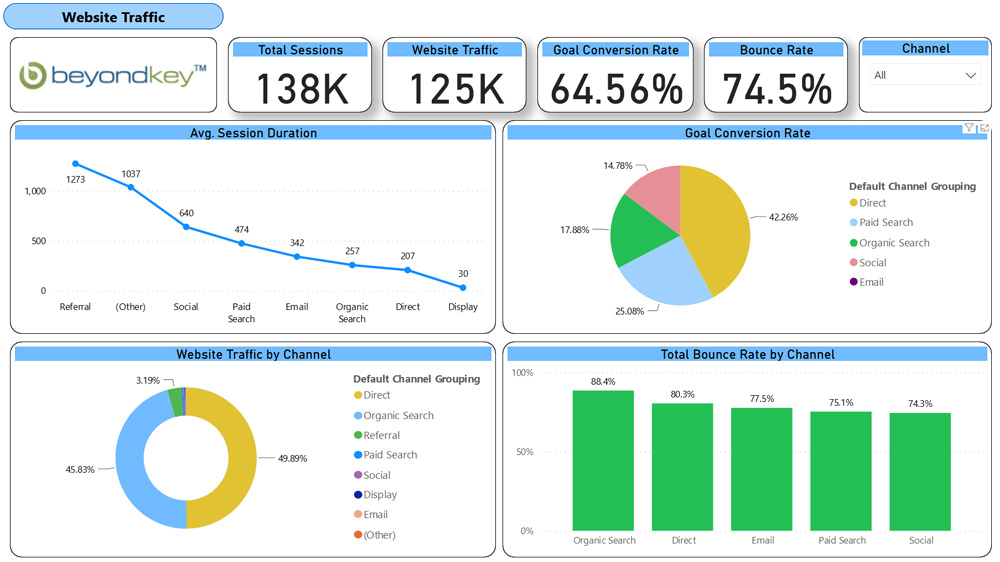
Website Traffic Dashboard
Using this dashboard, you can investigate your company website's traffic statistics, channel traffic, session length, and other important information. Our website analytics report covers metrics like total sessions tracked, website traffic, bounce rate, channel traffic sources, and goal conversion rate. The entire marketing department can use this dashboard to monitor website activity and understand how individual efforts contribute to overall outcomes.
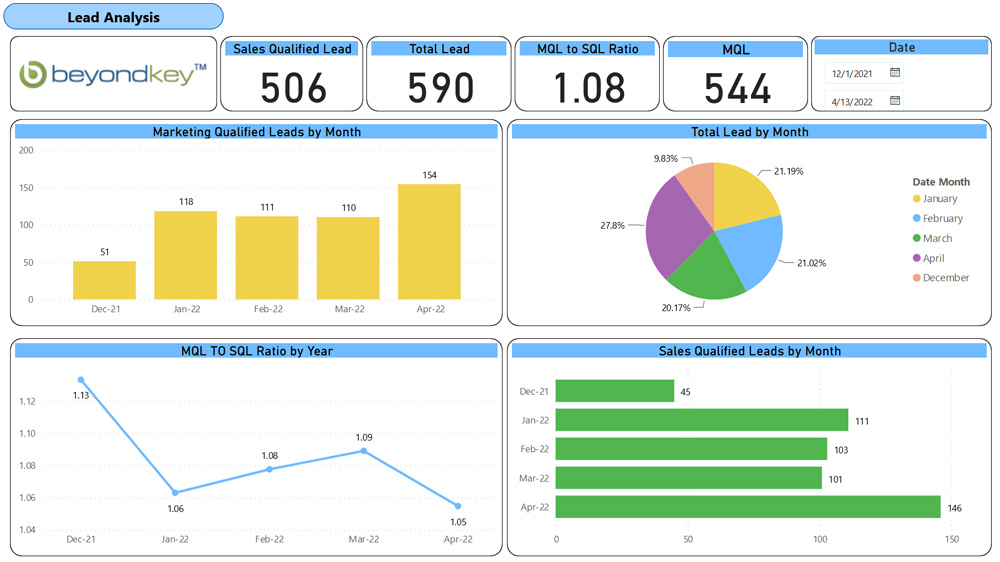
Lead Analysis Dashboard
Lead analysis is essential for marketers and salespeople in every firm. The main metrics recorded on this dashboard are the marketing qualified leads, sales qualified leads, overall lead goals, and the MQL to SQL ratio depending on various time frames. This dashboard demonstrates your ability to seize fresh lead opportunities from your marketing initiatives successfully. Based on prior statistics and closures, the analytical reports also help to make crucial decisions regarding the marketing and sales objectives.
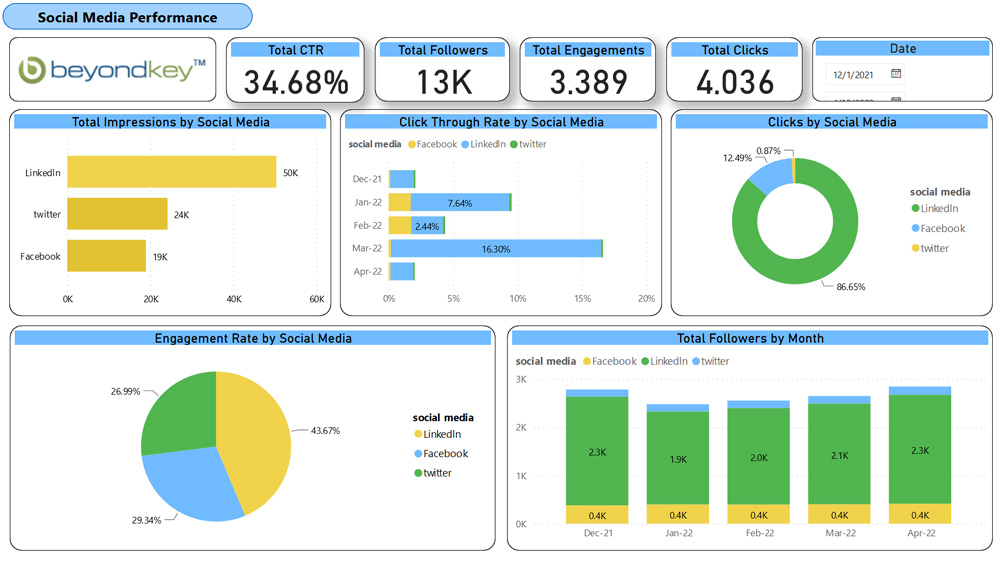
Social Media Dashboard
A social media dashboard monitors several social media platforms to increase traffic to your website. Deep insights on interaction, subscribers, followers, and impressions on your social media networks are provided by this dashboard. Your conversion rate will increase due to increased social media audience engagement, increasing your revenue. You can strengthen your social media strategy by carefully monitoring these essential variables.
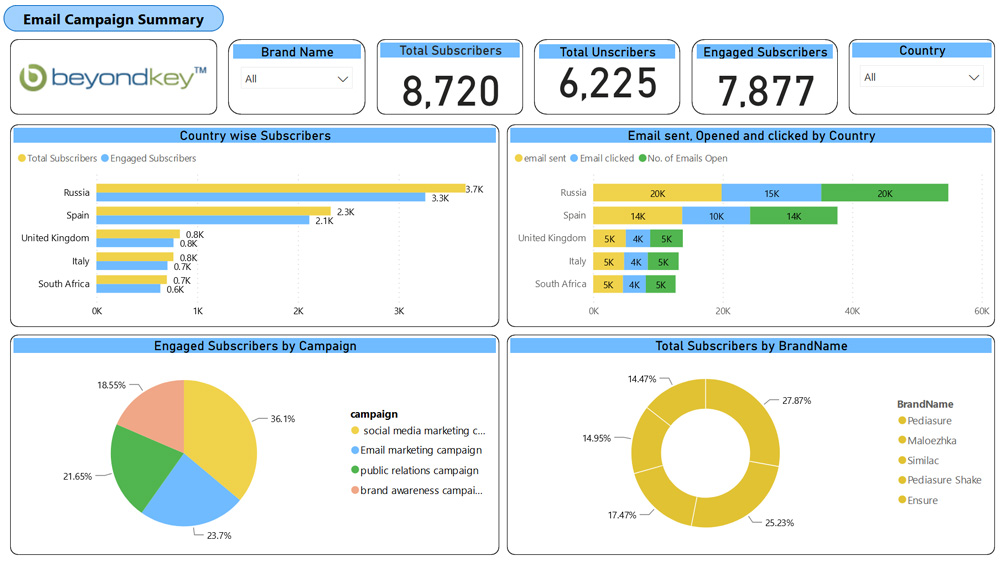
Email Marketing Performance Dashboard
A rapid overview of the emails is provided via an email marketing dashboard. Companies benefit from this choice since it gives you the chance to describe how your email marketing campaigns are doing briefly and the level of engagement you are generating. Email deliveries, open rates, click rates, total bounces, and subscribed and unsubscribed audiences are crucial for effective email marketing KPIs. This dashboard investigates the audience that receives your emails and whether they respond to your CTAs.
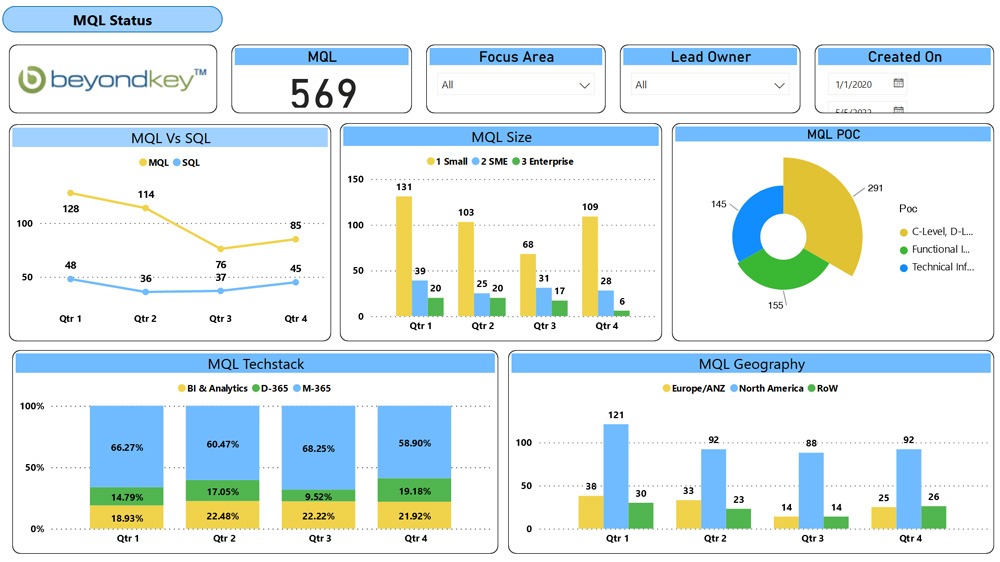
MQL Status Dashboard
This dashboard, as its title indicates, provides detailed facts regarding the Marketing-qualified leads that are being received by the system. Detailed data provides information about the organization's size, the location of the organization, its technology, or its products.
Check Out Our Latest Resources

Leading building materials company gets Power BI sales analytics dashboards to track their major KPIs
View Case Study
Data performance and Visualization improved by using Power BI analytical services for a US-based manufacturer
View Case Study


Video Testimonials


Hire Power BI Consultants
Want to leverage the hidden power of your data and have a 360-degree view of your business?