Simplify Project Management with the Power of Analytics and Project Management Dashboards
Ask for A Demo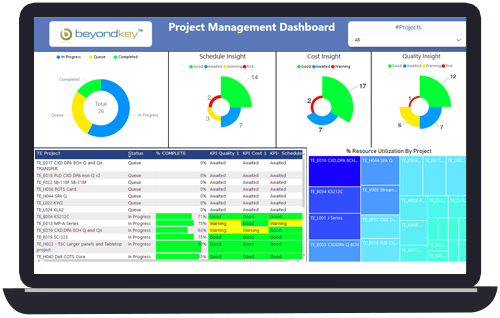


What is a Project Management Dashboard?
A Project Management Dashboard is a data dashboard created to centrally display metrics, statistics, insights, and key performance indicators (KPIs) referring to projects. You can visualize, monitor, optimize, and improve the performance of your projects using this single interface. Project management dashboards provide a comprehensive overview of your projects, making it easier to track progress, identify issues, and make data-driven decisions.
Teams using a Project Management Dashboard can:
- Create meaningful project visualizations
- Keep track of important performance indicators
- Produce valuable insights or information that your organization can use to do something.
- Utilize project management dashboard templates to streamline their processes
- Leverage power bi project management dashboards for enhanced data analysis and reporting
Overall, the project dashboard acts as a monitoring tool for teams to keep track of what's working and what isn't, and what needs to be changed to meet project goals. By utilizing project management dashboard examples, teams can gain inspiration and ideas for creating their own effective dashboards for project management.
What Can You Get from Our
Project Management Dashboards?
To adequately meet your team's needs for data visibility, our project management dashboard includes a number of key features and metrics. Our project management dashboard templates are designed to be flexible and adaptable to various project types and industries, ensuring that you have the right tools to effectively manage your projects.
Interested to know more about our Project Management Dashboards and analytics capabilities?
PROJECT MANAGEMENT DASHBOARD EXAMPLES
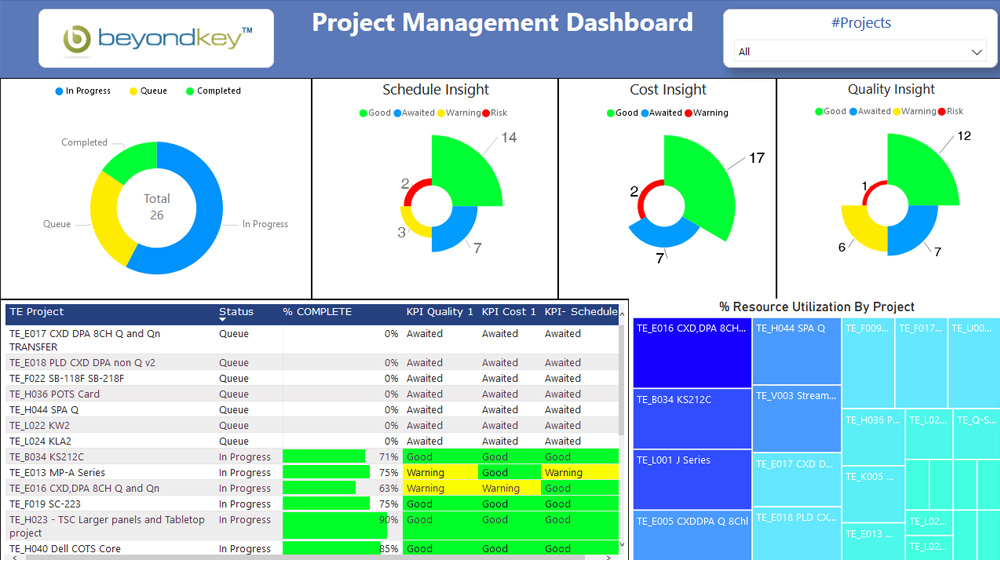
Project Portfolio Dashboard
An overview of the project is given in this report. The number of projects that are "In Progress," "Queue," and "Completed" can be tracked by clients. Additionally, they can track a project's progress based on "Schedule," "Cost," and "Quality." Depending on the project's scope, they can also see the resource. This project management dashboard template provides a high-level view of your entire project portfolio.
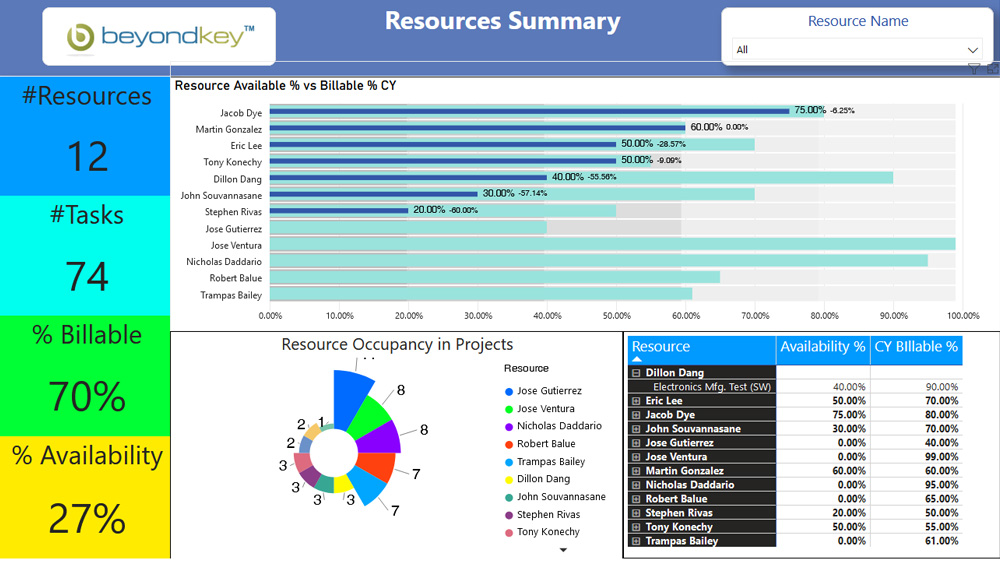
Resource Summary Dashboard
In this dashboard, we illustrated the number of resources available and billable in the current year's chart. Tasks, billable resources, and resource occupancy are displayed in this report for various projects. This project management dashboard example showcases how you can effectively manage and allocate resources across your projects.
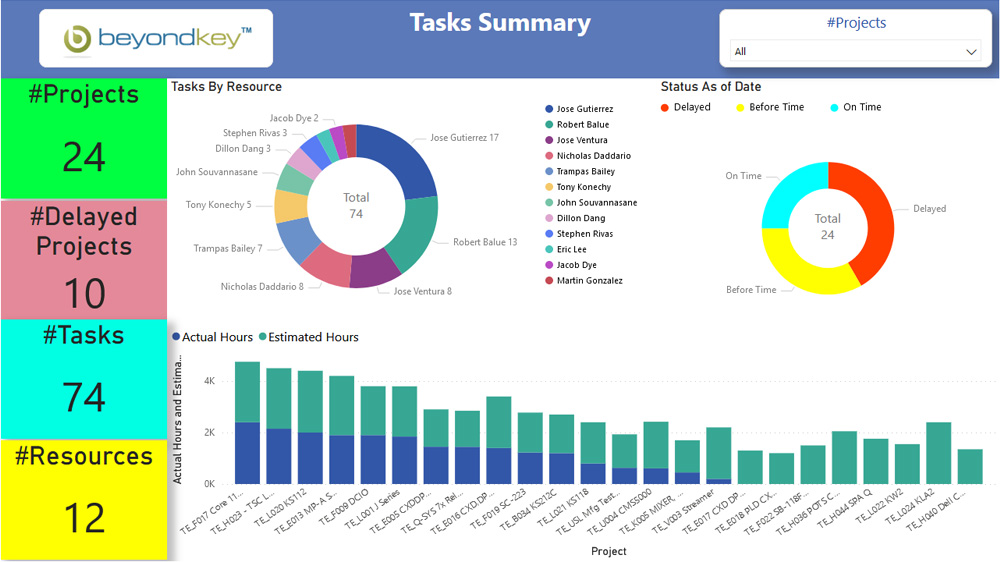
Task Summary Dashboard
The status of ongoing tasks is shown on this dashboard. We can view the tasks that have been finished as well as the time spent on each task. Additionally, it reports how many tasks are started, delayed, and finished on time. This project management dashboard template helps you stay on top of your tasks and ensure timely completion.
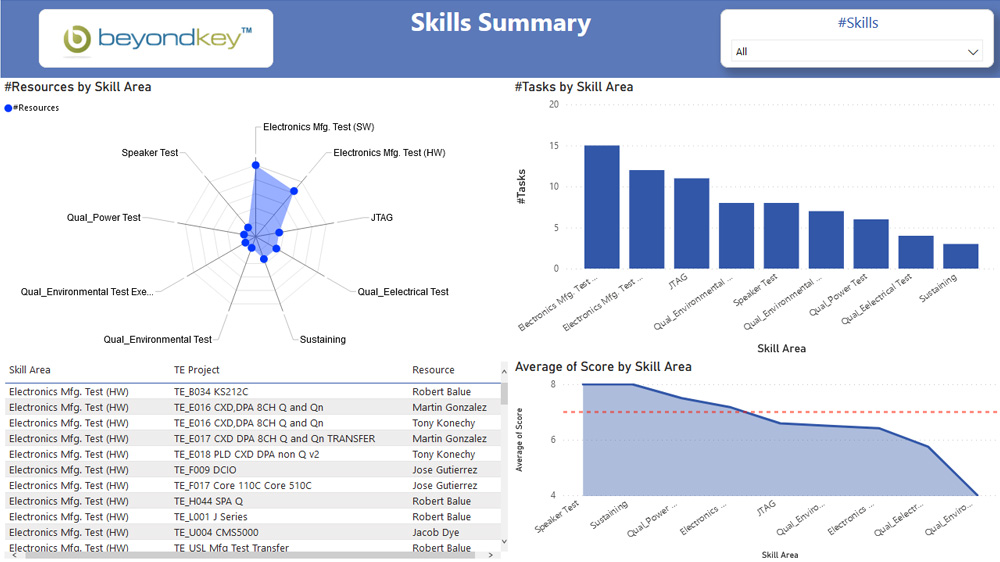
Skills Summary
This report focuses on skills. It demonstrates that in order to upgrade their resources, the average client's skill set needs training. Additionally, it alerts them to which client skills call for additional resources. This project management dashboard example highlights the importance of skills management in ensuring project success.
Check Out Our Latest Resources

Data performance and Visualization improved by using Power BI analytical services for a US-based manufacturer
View Case Study
Microsoft Power BI reports developed to manage end-to-end HR analytics, people information and data.
View Case Study


Video Testimonials


Hire Power BI Consultants
Want to leverage the hidden power of your data and have a 360-degree view of your business?