Gain new insights, and maximize profits with Financial dashboards.
Ask for A Demo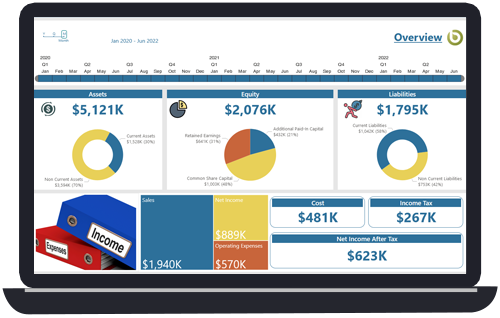
What is a Financial Dashboard?
A financial dashboard is a powerful tool for managing relevant financial data, providing a comprehensive view of your organization's financial performance. With a financial dashboard, you can track all your financial KPIs, manage cash effectively, and track expenses, sales, and profits to reach and exceed your financial goals. By using a finance KPI dashboard, you can get exact and unobserved meaningful information without complexities. You can use it to keep track of your cash flow and revenue throughout the organization, including revenue and costs. Integrating CRMs, ERPs, and other systems allows a unified view of the entire organization's data, making it an essential part of financial reporting dashboards.


How Our Financial Dashboards
Benefits Your Organization?
In today's fast-paced business world, financial professionals and departments face intense pressure to provide deep insights, clear and reliable financial reports, and help drive the company's performance higher. Financial dashboards provide insights into the company’s performance over time, its current finances, and projected future performance. Financial dashboards are reports that graphically represent critical data points, making data sharing simple and making it easier to interpret data. With a financial KPI dashboard, you can track key performance indicators and make data-driven decisions.
Want to track Financial metrics using our interactive dashboards?
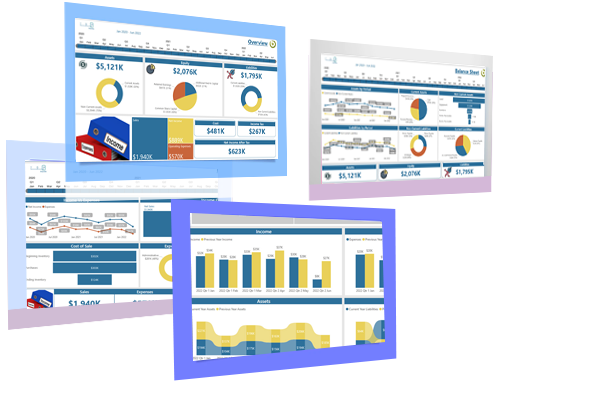
FINANCIAL DASHBOARD EXAMPLES
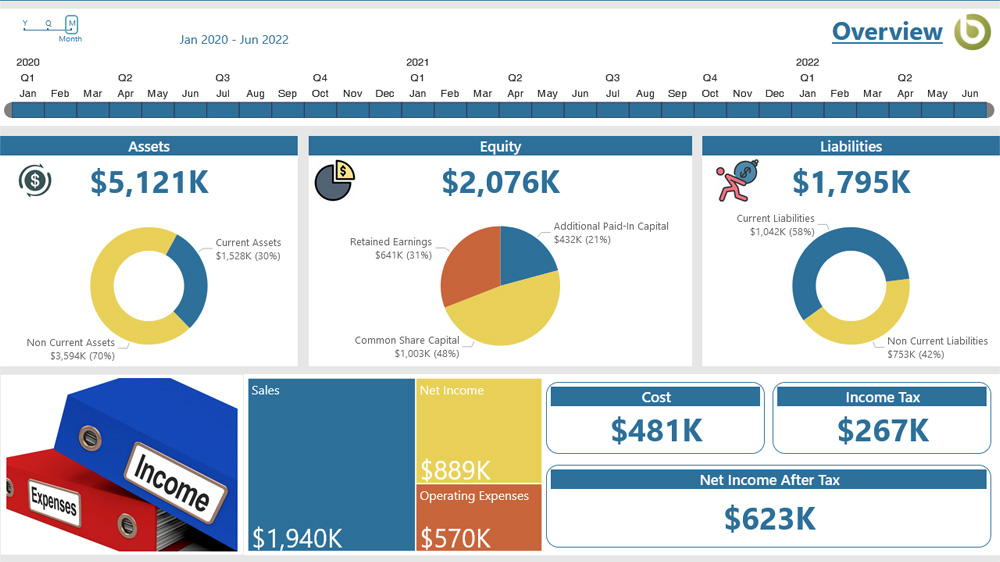
Overview Dashboard
This financial dashboard gives an in-depth insight into your business goals and helps you have a better view and opportunity to have a better sense of risk, to make better customer relations, financial performance, decision making, etc. It gives you a big picture of your Assets, Equity, Liability, Cost, Income, and Net Income after Tax earned over time, providing a comprehensive financial reporting system. With this financial kpi dashboard, you can track your key performance indicators (KPIs) and make data-driven decisions. This finance dashboard example is a perfect way to visualize your company's financial data and identify areas for improvement.
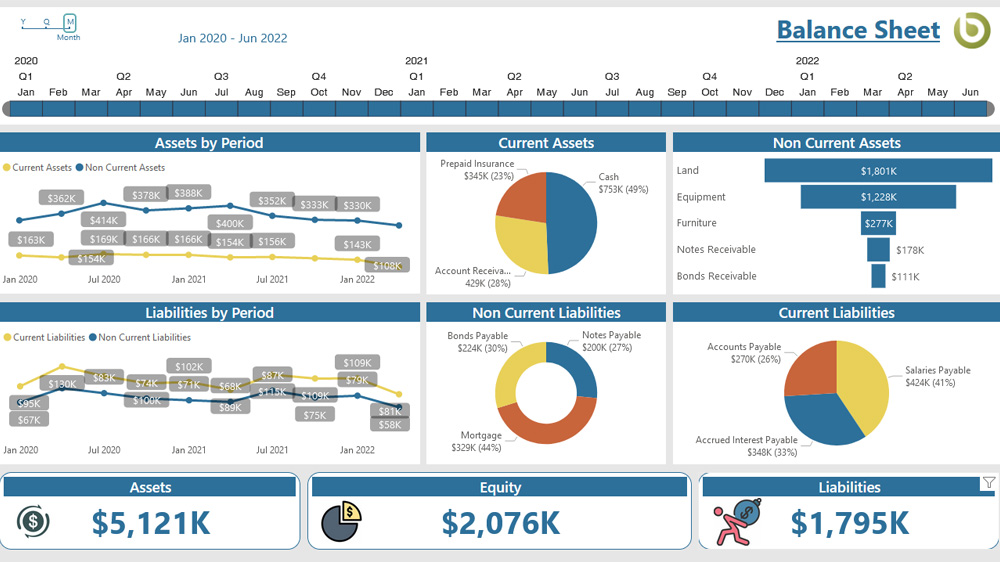
Balance Sheet Dashboard
The essential financial metrics of an organization are described in this Balance Sheet Dashboard. It represents the overall health of your business and provides a financial dashboard example of your company's financial situation. It ensures long-term viability and success by giving a way to communicate the key financial metrics of your balance sheet over time. It presents a valuable method for keeping track of your assets and liabilities, making it possible to assess your company's financial performance. This finance dashboard is designed to help you make informed decisions and drive business growth. With this beyond finance dashboard, you can go beyond traditional financial reporting and gain a deeper understanding of your company's financial health.
Additionally, this income statement dashboard provides a detailed breakdown of your company's revenue, expenses, and net income, giving you a comprehensive view of your company's financial situation. By using this finance kpi dashboard, you can track your key performance indicators (KPIs) and make data-driven decisions. This financial dashboard is a powerful tool for any business, providing a clear and concise way to visualize your company's financial data.
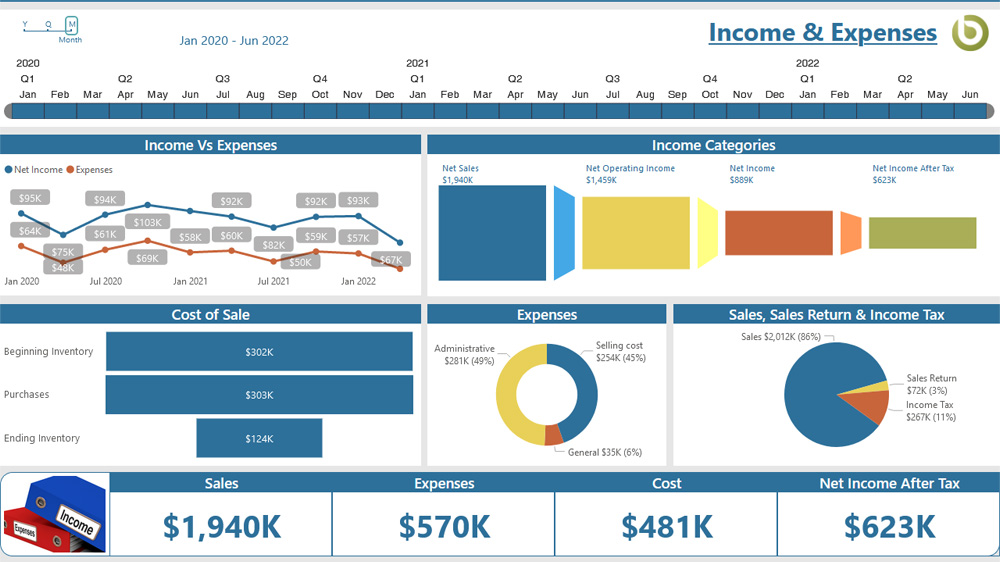
Income & Expenses Dashboard
This Financial Dashboard shows a timeline of your net income and expenses. Your expense and income reports can also provide you with additional information on your company's financial success, including information on your overall cost of sales, expenses, sales return, income taxes, and more. With this Financial Dashboard, you can track your financial performance in real-time, making it easier to make informed decisions.
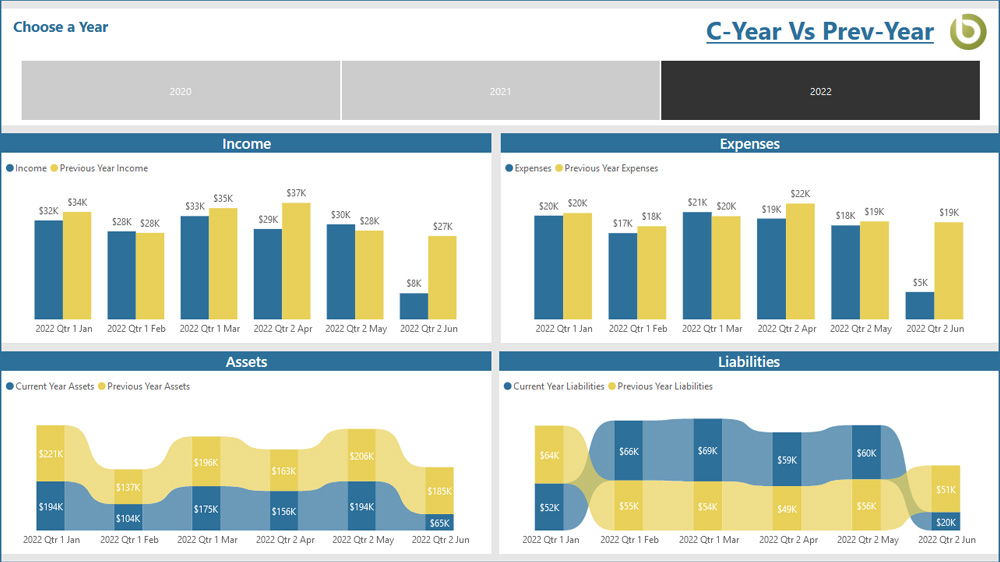
Comparison Year by Year Dashboard
This Financial Reporting Dashboard provides a yearly comparison between Assets, Liabilities, Income & Expenses. Financial Professionals and departments can deliver fast insights, and better decision-making and measure all the data accurately in real-time, increasing productivity and providing a stable Financial Environment. This Financial KPI Dashboard helps you track your financial performance over time, making it easier to identify trends and areas for improvement.
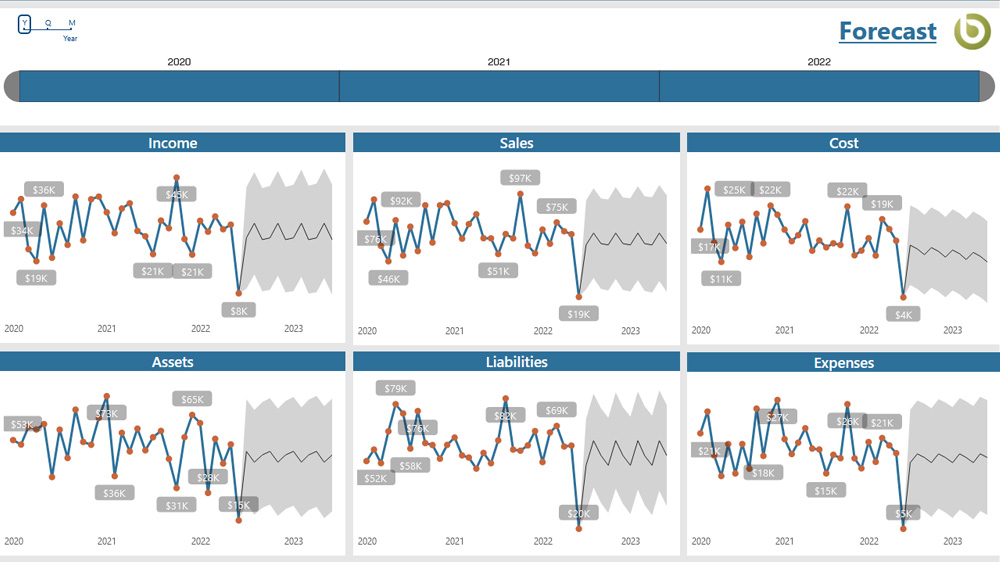
Forecasting Analysis Dashboard
This Financial Dashboard provides a forecasting analysis of Income, Sales, Cost, Expenses, Assets & Liabilities. This Financial Dashboard can help your organization to have an overall view of Growth, Profitability, Cash Generation, Solvability, Liquidity, etc., and will demonstrate your organization's yearly financial condition. With this Finance Dashboard, you can make informed decisions about your organization's financial future.
Check Out Our Latest Resources

Microsoft Power BI reports developed to manage end-to-end HR analytics, people information and data.
View Case Study
Data performance and Visualization improved by using Power BI analytical services for a US-based manufacturer
View Case Study


Video Testimonials


Hire Power BI Consultants
Want to leverage the hidden power of your data and have a 360-degree view of your business?