Maximize your Outcomes with our Sales Dashboards
Ask for A Demo
What is a Sales Dashboard?
Sales is the field that contains the most data, by a wide margin. There is a great need for everything in the field of sales to be both measurable and understandable, which explains why sales dashboards are so popular. The Sales Dashboard enables C-level executives and managers to efficiently monitor sales KPIs (key performance indicators) through a detailed analysis of Sales Performance, Cycle Times, and Sales Funnels.
Modern sales dashboards make it simpler and easier to follow the team performance, sales opportunities, closed deals, and various other sales KPIs on a daily or strategic level.


What are Sales KPIs and their importance?
Sales KPIs are metrics that monitor how well your employees, departments, or the whole company are doing compared to its objectives.
Often extra support to your sales managers, leaders, and salespersons by assisting in tracking target progress, managing team and individual performance, and identifying overarching themes and trends. Your company's sales leaders and their teams can optimize their sales process, make sure they are moving in the right direction, and prioritize the right activities for the best results by measuring the appropriate KPIs for sales. Meeting your sales budget is of the utmost importance because results are the basis of all budgeting.
Here are some Sales KPIs:
How can Sales Dashboards be beneficial for your organization?
The Sales Dashboard simplifies complicated data into useful chunks of knowledge that can be used by you to gain practical business insights. A Sales Dashboard's primary function is to gather the data that can be used to take the most effective actions from your CRM system and display it in a more appealing manner. Understanding the precise objectives, you're attempting to achieve is the most difficult task of creating a sales dashboard. Start by determining the most important metrics to monitor in order to ensure maximum effectiveness.
Need more information on our Sales Dashboards and Analytics?
SALES DASHBOARD EXAMPLES
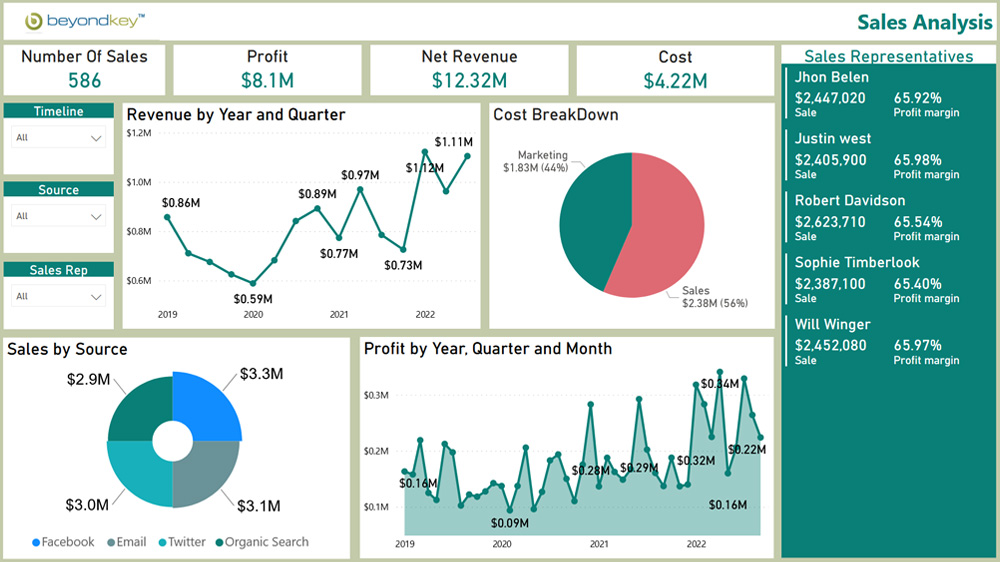
Sales Analysis Dashboard
The sales analysis dashboard is a comprehensive dashboard and visualization chart that provides salespeople with fast insights into the volume of sales, profit, net revenue, and expenses incurred during the specified time. Along with providing detailed information on revenue and profit by year, quarter, and month, it also provides an overview of the sales team's performance. Related to that, it gives information on expenses incurred and sales by source. This dashboard's KPIs can be changed.
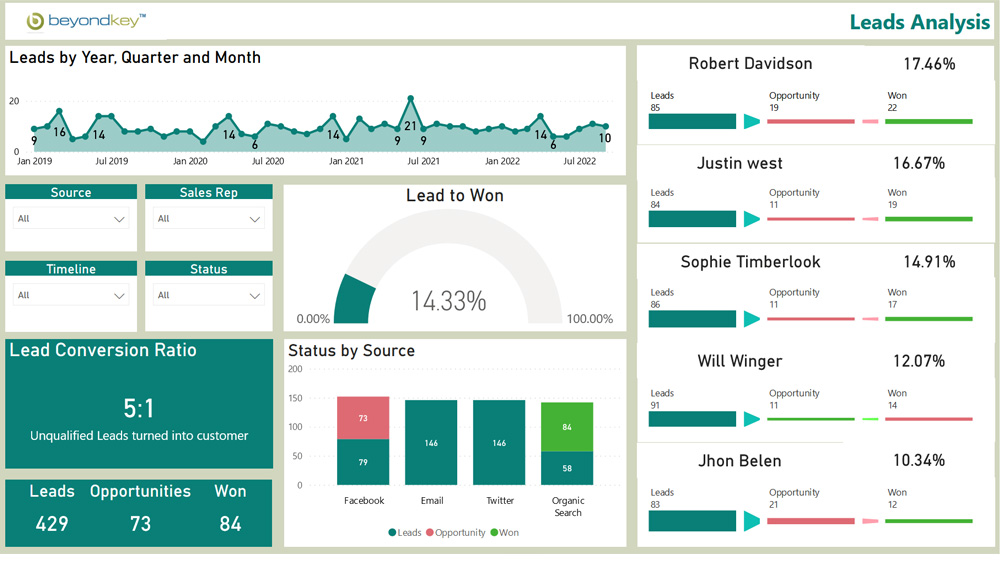
Lead Analysis
The Leads Analysis dashboard, also called the sales-to-funnel dashboard, gives you a complete picture of how leads enter and exit your system. Using this visual chart, your sales team can monitor the number of leads coming in over a given time. The metrics for leads won and lost, leads to opportunities, and leads by sales representatives are also displayed. This enables the stakeholders to quickly understand the state of the company and the work put into each daily conversation. It is a dashboard that provides in-depth information and allows users to dig deeper into the Leads KPIs to identify areas for potential future improvement.
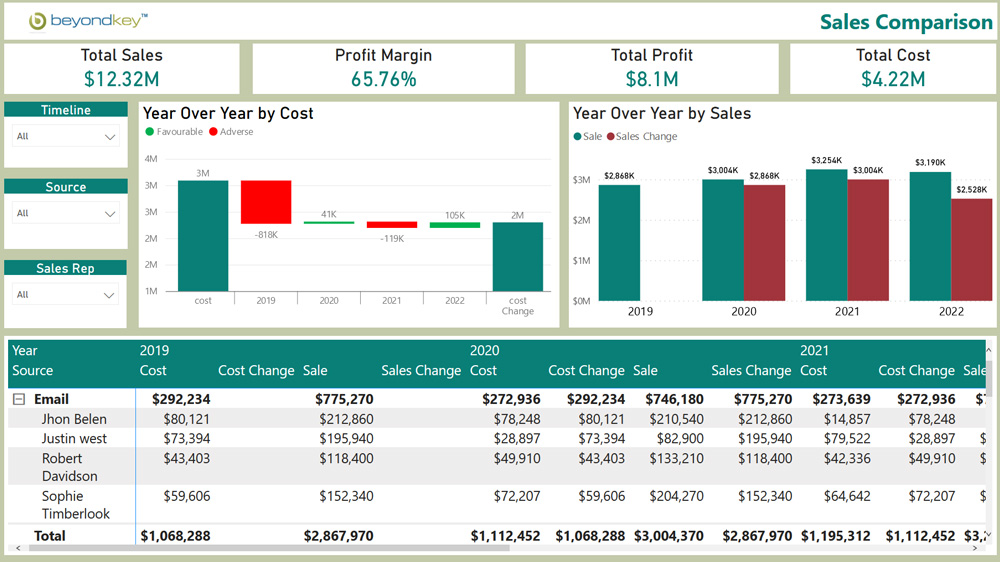
Sales Comparison Dashboard
The sales comparison dashboards provide comparative information on total sales, profit, and expenses over time, either annually or monthly. This makes it easier to understand how your sale and the overall success of your company. A bar graph is used to display the comparison. Along with this tabular breakdown of cost and sales over time, metrics are also displayed to help you quickly understand your company's growth rate and how it can be accelerated further in the years to come.
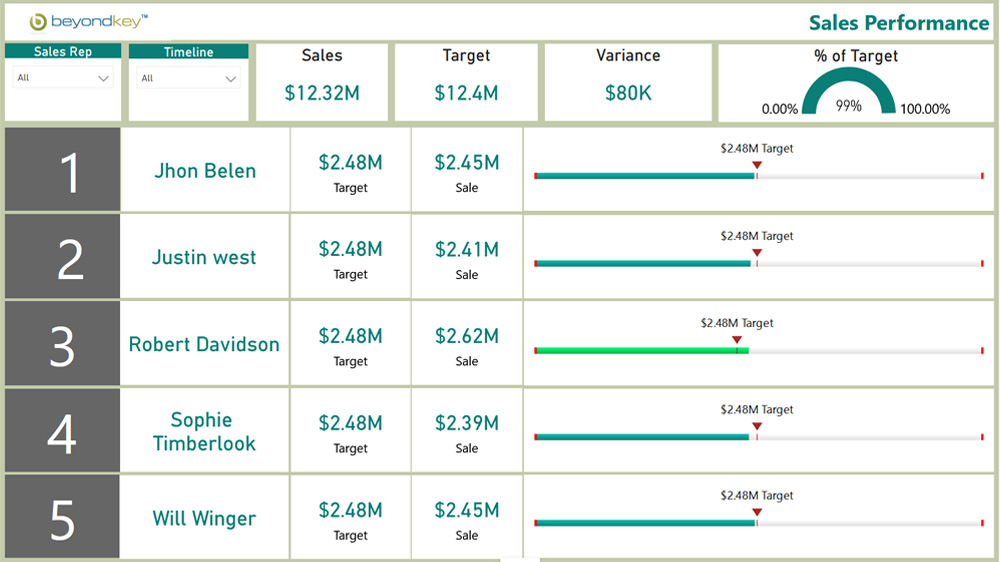
Sales Performance Dashboard
The report known as the sales performance dashboard is significant. The top sales executives and stakeholders can benefit from keeping an eye on this dashboard. It provides information on how those in the organization who is in charge of sales perform. After examining this sales performance dashboard, key metrics such as the targets for each, the percentage of targets achieved, and who is performing and who is unable to perform can all be examined.
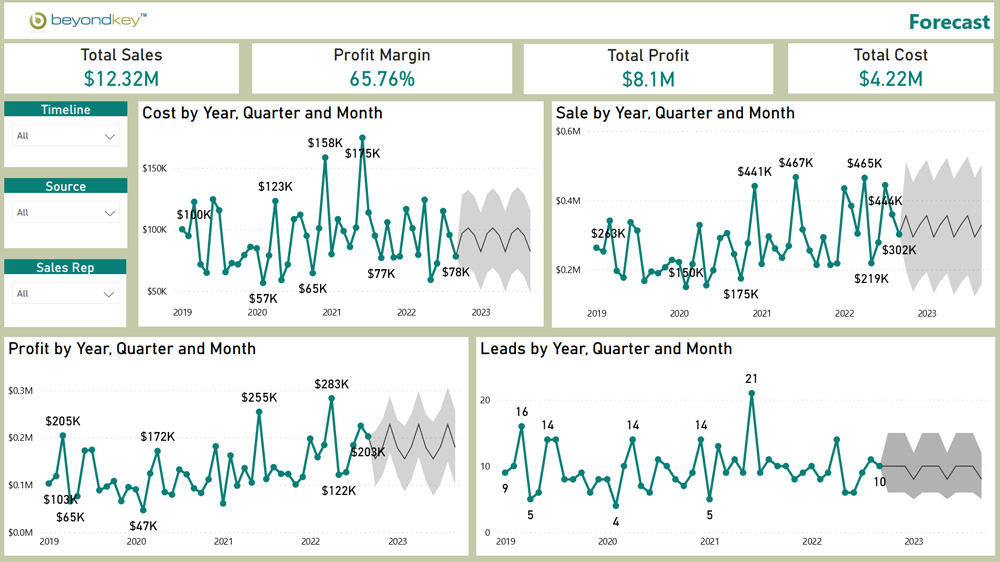
Forecasting Dashboard
The figures provided by the sales forecast serve as the foundation for creating the sales budget, production budget, marketing budget, production mix, and expansion plans. Forecasts help with risk management by identifying early warning signs in sales pipelines. As a result, forecasting accuracy becomes even more crucial. Based on historical data, it predicts the values of your essential data that affect your business for future days.
Check Out Our Latest Resources

Leading building materials company gets Power BI sales analytics dashboards to track their major KPIs
View Case Study
Data performance and Visualization improved by using Power BI analytical services for a US-based manufacturer
View Case Study

Video Testimonials


Hire Power BI Consultants
Want to leverage the hidden power of your data and have a 360-degree view of your business?