Make the Most of Your Workforce with Our HR Dashboard
Tired of reports that don't help? Introducing Beyond Intranet’s HR Dashboard. This software compiles and converts your organizational info into easy dashboards. HR’s use it to build better places where employees love to work—ultimately saving the company’s money when used right! See how it happens.
Request a Demo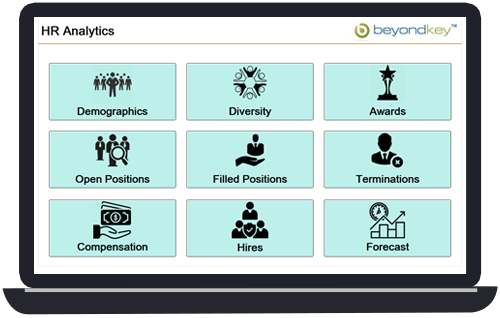


What is an HR Dashboard?
An HR dashboard brings together important people information for managers and leaders. Instead of sorting through papers, you can see things like hiring, training, and how staff do their jobs on one screen. A good dashboard uses data software to track patterns and predict what will happen next.
Many companies now use an online HR dashboard. This helps oversee tasks like picking new employees and making sure current ones improve. Dashboards let teams follow recruiting, developing talent, and judging performance. HR professionals get an easy way to check these processes.
Some examples gather data on schedules, pay, and skills to help make decisions. One type of dashboard specializes in numbers related to managing staff. Another focuses specifically on analyzing workforce statistics. Choosing the right dashboard puts companies in control of their people.
Does your business need a tool like this? Schedule a demo to learn more about how the HR dashboard works.
One Place for Workforce Data
Managing staff needs across areas is tough. But our hr dashboard quickly finds important patterns. Departments use our people analytics dashboard to guide training and reviews. Time to save hours spent making paper reports.
See a Live Demo of Your Customizable Dashboard
HR Dashboard Examples
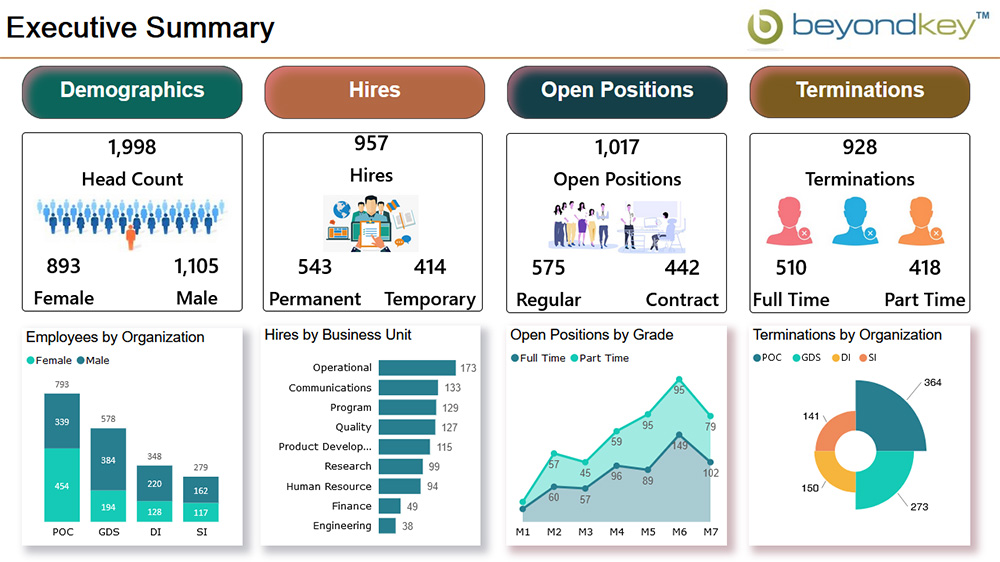
Executive Summary Dashboard:
Gives leadership a quick look at key workforce indicators like demographics, new hires, departures and open roles. Insights are visual and easy to understand.
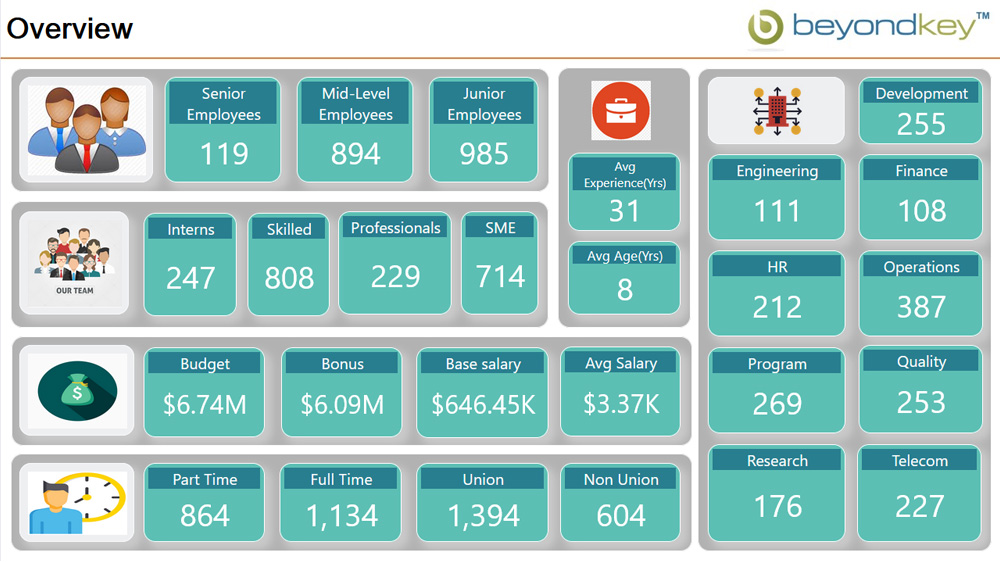
Overview Dashboard:
Shows complete workforce data such as finance details, department activities and time spent with the organization. Also tracks average experience, age brackets and salary ranges.
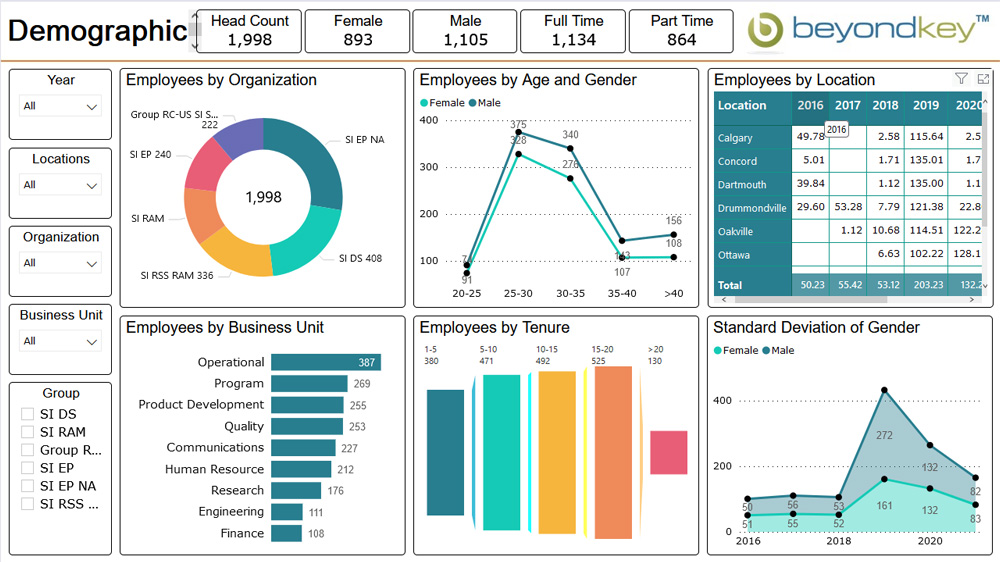
Demographics Dashboard:
Helps monitor the balance of your staff. HR analyzes employee tenure, roles, functions, locations and diversity indicators like gender and culture. This people analytics dashboard provides the fuller context leaders need to nurture an inclusive company culture and compliant hiring practices.
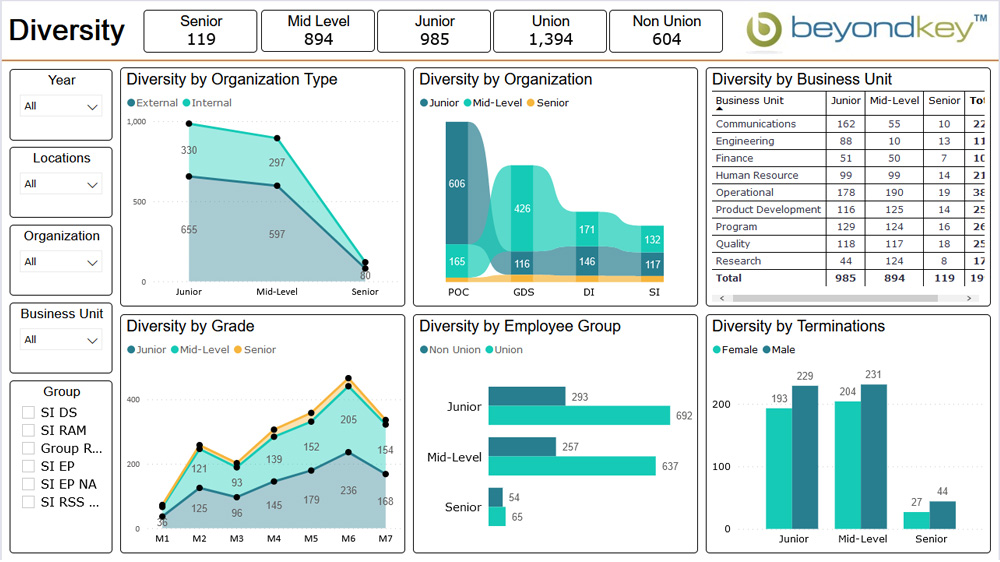
Diversity Dashboard:
Tracks key metrics of DE&I success like representation across roles. Identifies areas for improving culture and belonging through employee analytics.
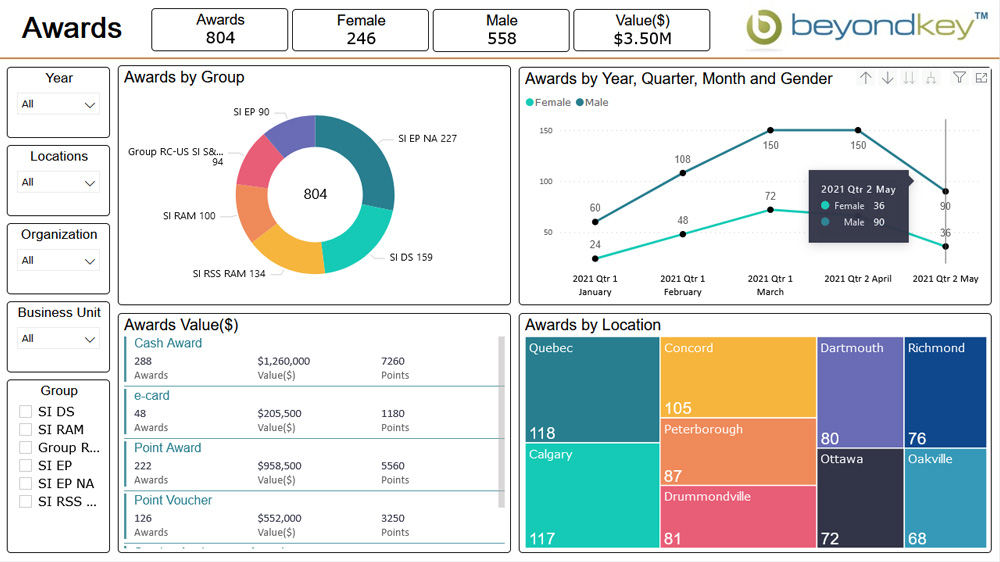
Awards Dashboard:
Shows team honors and annual goals completion. Find breakdowns by location, job type and more. Celebrates excellence across the workforce.
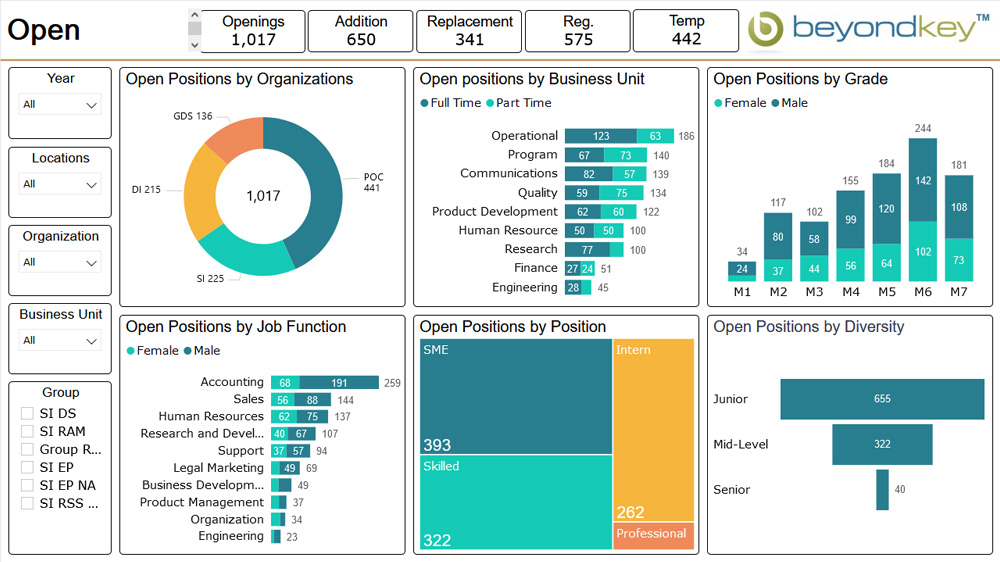
Open Positions Dashboard:
Offers filters to view unfilled roles by department, duties, diversity and other criteria. Inform strategic recruiting decisions from people analytics insights.
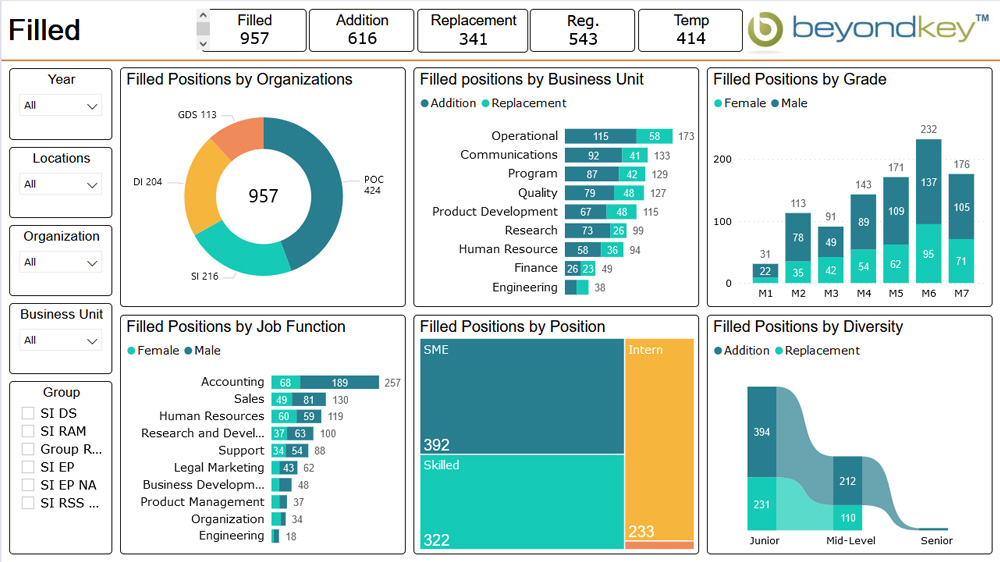
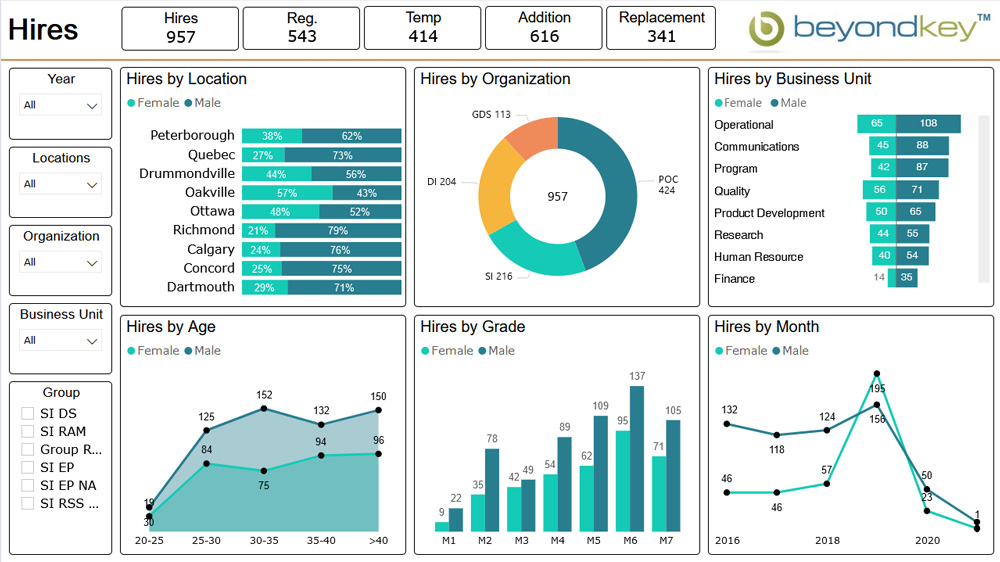
Filled Positions Dashboard:
Displays new hires with details on location, job level and other categories. Understand patterns that strengthen recruitment processes.
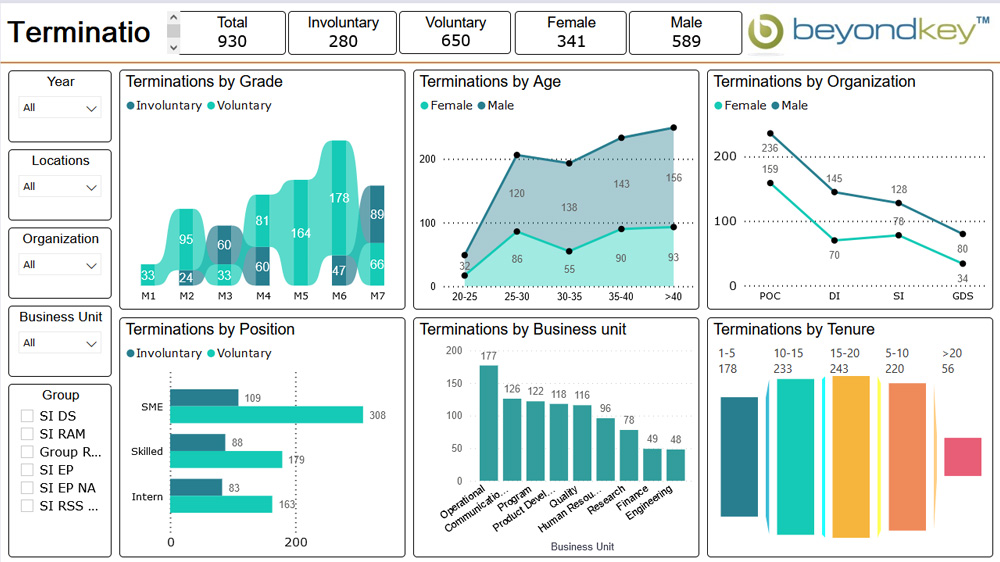
Terminations Dashboard:
Gives a full picture of departures like experience, age and organizational factors. Identify attrition risks and opportunities for retaining top talent through retention dashboards.
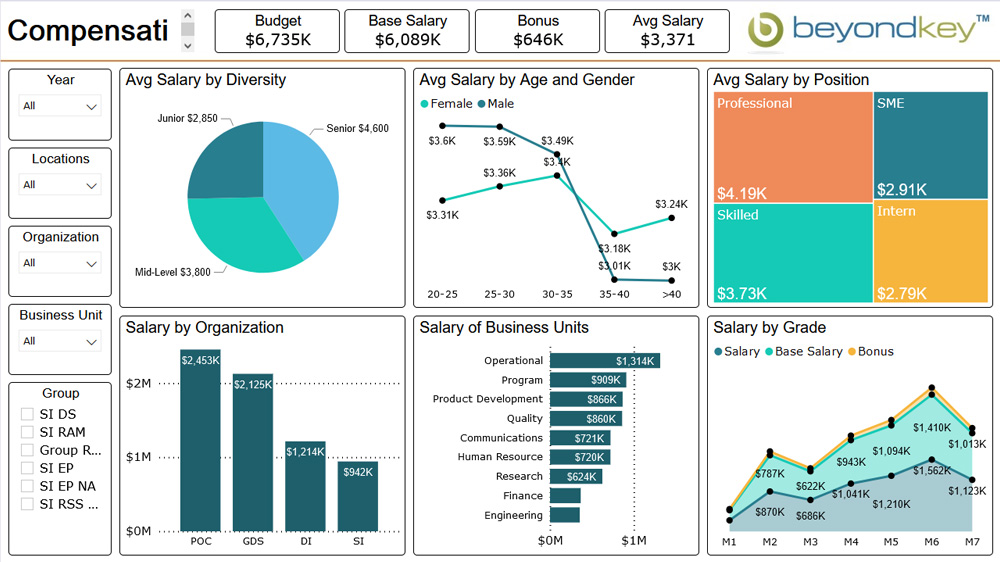
Compensation Dashboard:
Views average employee pay broken out by age, gender, role, team and other factors. Craft equitable salary strategies and keep costs transparently managed.
Hiring Dashboard:
Centralizes application details, timelines and outcomes to assess recruiting performance. Identify top sourcing channels and streamline processes based on location, role or time of year through candidate tracking dashboards.
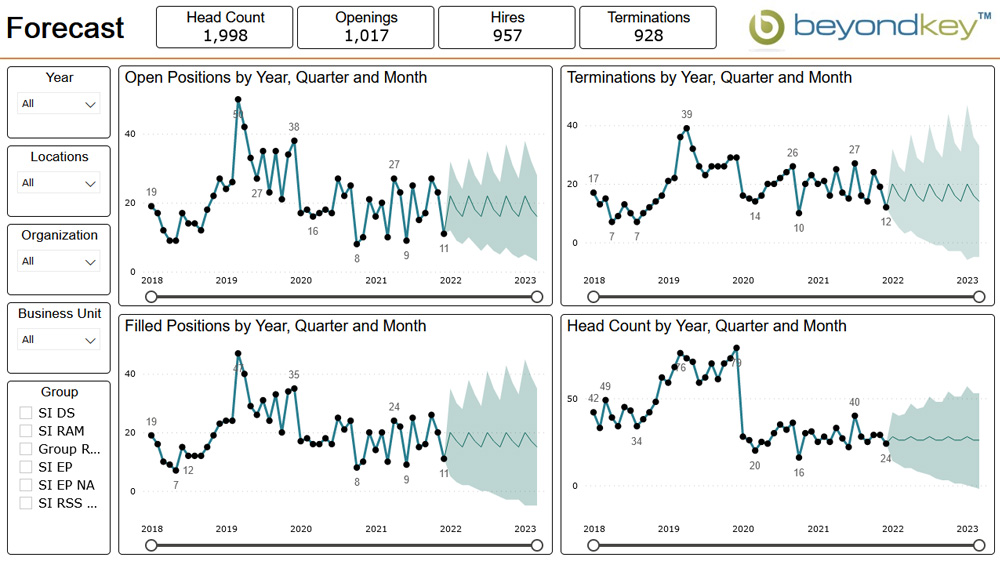
Forecasting Dashboard:
Predicts future openings, departures and headcounts so you know future staffing requirements. Forecast staff needs proactively using attrition prediction dashboards to minimize disruptions.
During demos, we'll navigate options for your unique needs.
Schedule My DemoWhat HR Dashboards Can Do
HR dashboards help teams get more from their people data. Insights replace scattered spreadsheets.
With these tools, your HR department can:
-
Track many workforce areas together like recruiting and staff growth. HR dashboards combine important metrics and save time vs paper.
-
Discover patterns that improve hiring and how well jobs fit candidates. Analytics reveal strategies to attract and keep the right employees.
-
Plan ahead by predicting needs like which roles need filling later. The HR power bi dashboard prepares your workforce for future business changes.
-
Monitor all key processes centrally like reviews, pay changes or time off. The hr metrics dashboard helps optimize these core activities.
-
Understand your workforce makeup and how inclusive your culture is. The people analytics dashboard helps support diversity and belonging for all.
-
Evaluate programs and policies to see what really affects things like worker morale or productivity. Data from the hr dashboard examples allow fact-based decisions.
-
With insights from tools like ours, HR can collaborate closer to business goals. Your team TRANSFORMS from support to strategy stakeholders!
Key Metrics Tracked in HR Dashboards
Understanding core workforce data helps HR optimize processes and plan strategically. Common KPIs available through our dashboards include:
Talent Acquisition:
Track time-to-hire, job applications, cost-per-hire. Spot top recruiting channels and enhance sourcing.
Workforce Planning:
Forecast openings and needed skills. Align staffing proactively with shifting business needs.
Performance:
Benchmark goals completion and competency development. Encourage individuals to fulfill their roles.
Diversity:
Monitor representation across roles and locations. Nurture an inclusive culture with balanced demographics.
Compensation:
Compare salaries against market rates. Maintain pay equity and budget appropriately.
Attrition:
Identify at-risk talent from exit surveys. Reduce unnecessary turnover through targeted retention.
By analyzing integrated metrics through tools like our employee dashboard, HR gains insights driving strategic collaboration and continuous process optimization.
FAQs
- Tracking processes like recruitment, pay changes, time off requests. monitor core activities
- Planning future staff needs
- Comparing numbers over time to find ways to improve processes
- Supporting equal opportunities by analyzing staff diversity
- Forecasting future hiring demands or turnover risks
- Benchmarking metrics against goals
- Executive dashboards with high-level workforce summaries
- Detailed people analytics dashboards
- Metrics dashboards that drill into core KPIs
- Employee dashboards offering role-based views
- Forecasting dashboards estimating future demands
Examples also provide pre-populated data visuals covering areas like demographics, compensation and more and allow customization.
Check Out Our Latest Resources

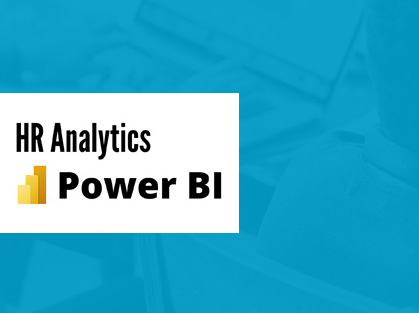
Microsoft Power BI reports developed to manage end-to-end HR analytics, people information and data.
View Case Study
Data performance and Visualization improved by using Power BI analytical services for a US-based manufacturer
View Case Study
Video Testimonials
Hire Power BI Consultants
Want to leverage the hidden power of your data and have a 360-degree view of your business?